

530A Account (Trump Account): A New Tax-Advantaged Savings Option For Children
On July 4, 2026, a new tax-advantaged investment account was officially launched by the US government: 530A accounts, also known as Trump accounts.

Why Long-Term Advisor Relationships Matter More as Wealth Grows
There has never been more access to financial information to guide investment decisions, yet that information is not designed for the individual investor behind it.

How to Simplify a Financial Life That’s Grown Complex
As life grows, finances usually do too. More responsibilities, more accounts, more decisions, and more pressure to make the right calls can turn a once-simple financial life into something that feels harder to manage.

Global Conflict and Market Volatility: Why Diversification Matters
Recent market volatility has understandably raised emotions and concerns over the last week. When headlines are alarming and markets move sharply up or down, it is natural for you to wonder about their investments.

SJS Book Club: Why Small Habits Matter for Investing, Retirement, and Life
At SJS, we often talk about what it means to build a better life. While investing and financial planning play an important role, we know the foundation of a better life is much broader than simply making sound financial decisions. Living a more meaningful life often starts with small, consistent habits.
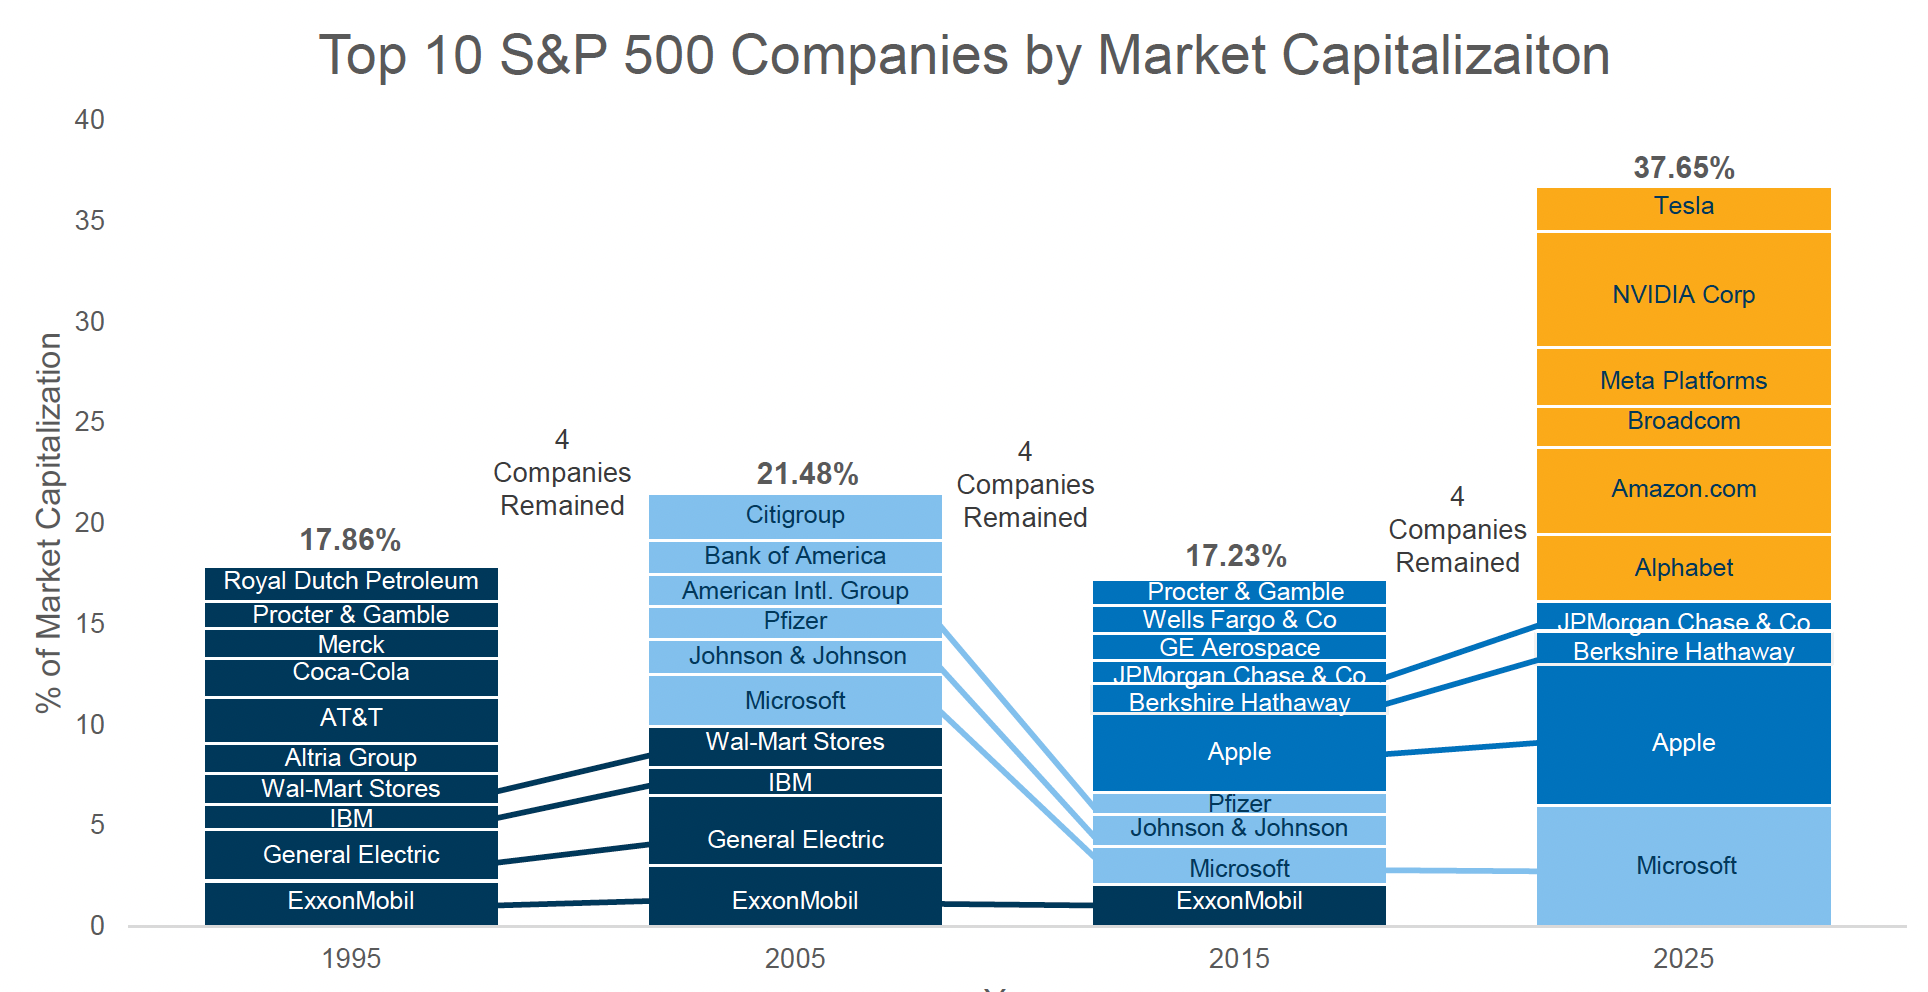
AOL to AI: How Innovation Keeps Reshaping Market Leadership
Do you remember when AOL was the internet? When hearing “You’ve got mail” felt like a small event, and logging on meant you were connected to the future?

Roaring Returns: 2025 Market Recap and Outlook
2025 closed out with global stock markets delivering another remarkable year, capping one of the strongest three-year stretches in stock market history. The April correction now feels like a distant memory as tariff shocks came and went.

SJS Quarterly Outlook – January 2026
Each quarter, we create an outlook that covers topics including general investment market conditions, financial planning considerations, and SJS news.

From Capitol Hill to Main Street: How the Big Beautiful Bill Impacts Your Business
As we discussed in our last blog post, Congress passed the long-anticipated One Big Beautiful Bill Act (OBBBA). True to its name, this legislation covers a wide range of tax and financial provisions. And for business owners in particular, the impact is meaningful [1].

5 Investing Lessons Learned & Re-learned In 2022
The end of the year provides a great time for us to reflect on recent experience to divine lessons to help us going forward.

The Gold Rush?
History has shown that over long periods of time, gold has often failed to outpace inflation, even before considering fees.

This Too Shall Pass
As advisors and professional investors, we hold vivid memories of the times when markets are volatile and bear markets ensue.

What Should You Do About A Recession?
We explore what is a recession, how the US stock market has performed before and after a recession, and how an investor can prepare for recessions.

Inflation Protection Through Series I Savings Bonds
Series I Saving Bonds provide many of the benefits of TIPS, but may be even more beneficial during times of heightened inflation.

What Is Driving Inflation, And What Can You Do About It?
Global stock and bond markets have been tested by inflation many times in the past, and these markets have historically demonstrated their resilience in providing returns higher than inflation over time.

What Makes A Great Investor?
In my opinion, investing is arguably the most competitive field in the world. So what differentiates a great investor from the rest?

Market Corrections & Market Highs
We believe that trying to time when to get in and out, or what to buy and sell, represents little more than gambling.

The Fed Poked The Bear
Rising interest rates are not always a bad thing. As interest rates move higher, the drop in value can be concerning, but in the longer-term, higher rates mean higher expected returns for investors, as bonds begin to produce more income.

The Certainty of Uncertainty - Your Investments During Geopolitical Events
On the conflict in Ukraine, how that may impact investment markets, and what you can control within your investment portfolio.

The Growth of Real Estate
As anyone who was looking to purchase or sell a home in 2021 knows, the US real estate market grew a lot in value in 2021. Will this continue?