
A Cautionary Tale of Concentration & Exuberance
By Chief Investment Officer Tom Kelly, CFA.
The value of investment markets lies in the unknowable future. No one knows exactly what comes next - despite what some may claim.
What we do know, grounded in academic research, is that valuations matter. Today, the S&P 500 Index (a proxy for U.S. stocks) is pressing against historical highs in Forward Price-to-Earnings (P/E). U.S. stock markets are also currently significantly richer than their international counterparts, based on historical data.

Source: Morningstar. Stock markets are represented by the following indices: US - S&P 500 Index; International Developed - MSCI World ex USA Net Return USD; Emerging Markets - MSCI Emerging Markets Net Return USD. 12-Month Forward P/E ratio is a stock valuation metric that divides a company's current stock price by its projected earnings per share (EPS) over the next 12 months. See Important Disclosure Information. *Interquartile range reflects the "middle 50%" of the range of historical valuations from the 25th to 75th percentile.
We also know that concentration reduces diversification across securities, leaving portfolios more exposed to the performance of a handful of stocks - for better or worse. Currently, concentration in the S&P 500 is close to as high as it has been.
We’ve seen valuations and concentration like this before. In the late 1990s, technology companies dominated the market. When the dot-com bubble burst in 2000, the S&P 500 index earned -9% (-1% annualized) over the following ten years beginning in January 2000, a stretch many still call “the lost decade.” During that same period, International Developed stocks eked out a 17% gain (2% annualized), while Emerging Markets stocks surged 154% (10% annualized). Diversification proved its worth.1
Since then, the S&P 500 has more than recovered, compounding over 14% annually and outpacing other international stocks by a wide margin.1 Understandably, this success leaves some investors wondering, "Why not invest solely in a S&P 500 Index fund?" But imagine opening your portfolio statement after ten years and seeing a negative number. Not a pleasant memory for those who lived through it.
Given ever-present uncertainty, the best we can do for you is to continue to hone the art of matching your goals and risk profile with a portfolio design that you won’t abandon in a down market. That philosophy is why we resist the temptation to chase what has worked most recently. What matters most is building a portfolio you can stick with, through good times and bad.
So far this year as of September 30th, the S&P 500 is up 15%. International Developed and Emerging Markets stock indices have returned 25% and 28%, respectively. We’ll gladly take these results of this global exposure. While our portfolios are not immune to market movements, diversification remains a core principle of MarketPlus® Investing.1
We are not predicting a crash in U.S. stocks. They may very well continue climbing, fueled by AI developments. But risks include both those we can see and those we cannot yet imagine. Continually reviewing valuations and investment market expectations when shaping portfolio design is one of the many ways we strive to help you cut through the noise of the markets and focus instead on time-tested strategies designed to help you achieve your long-term goals.
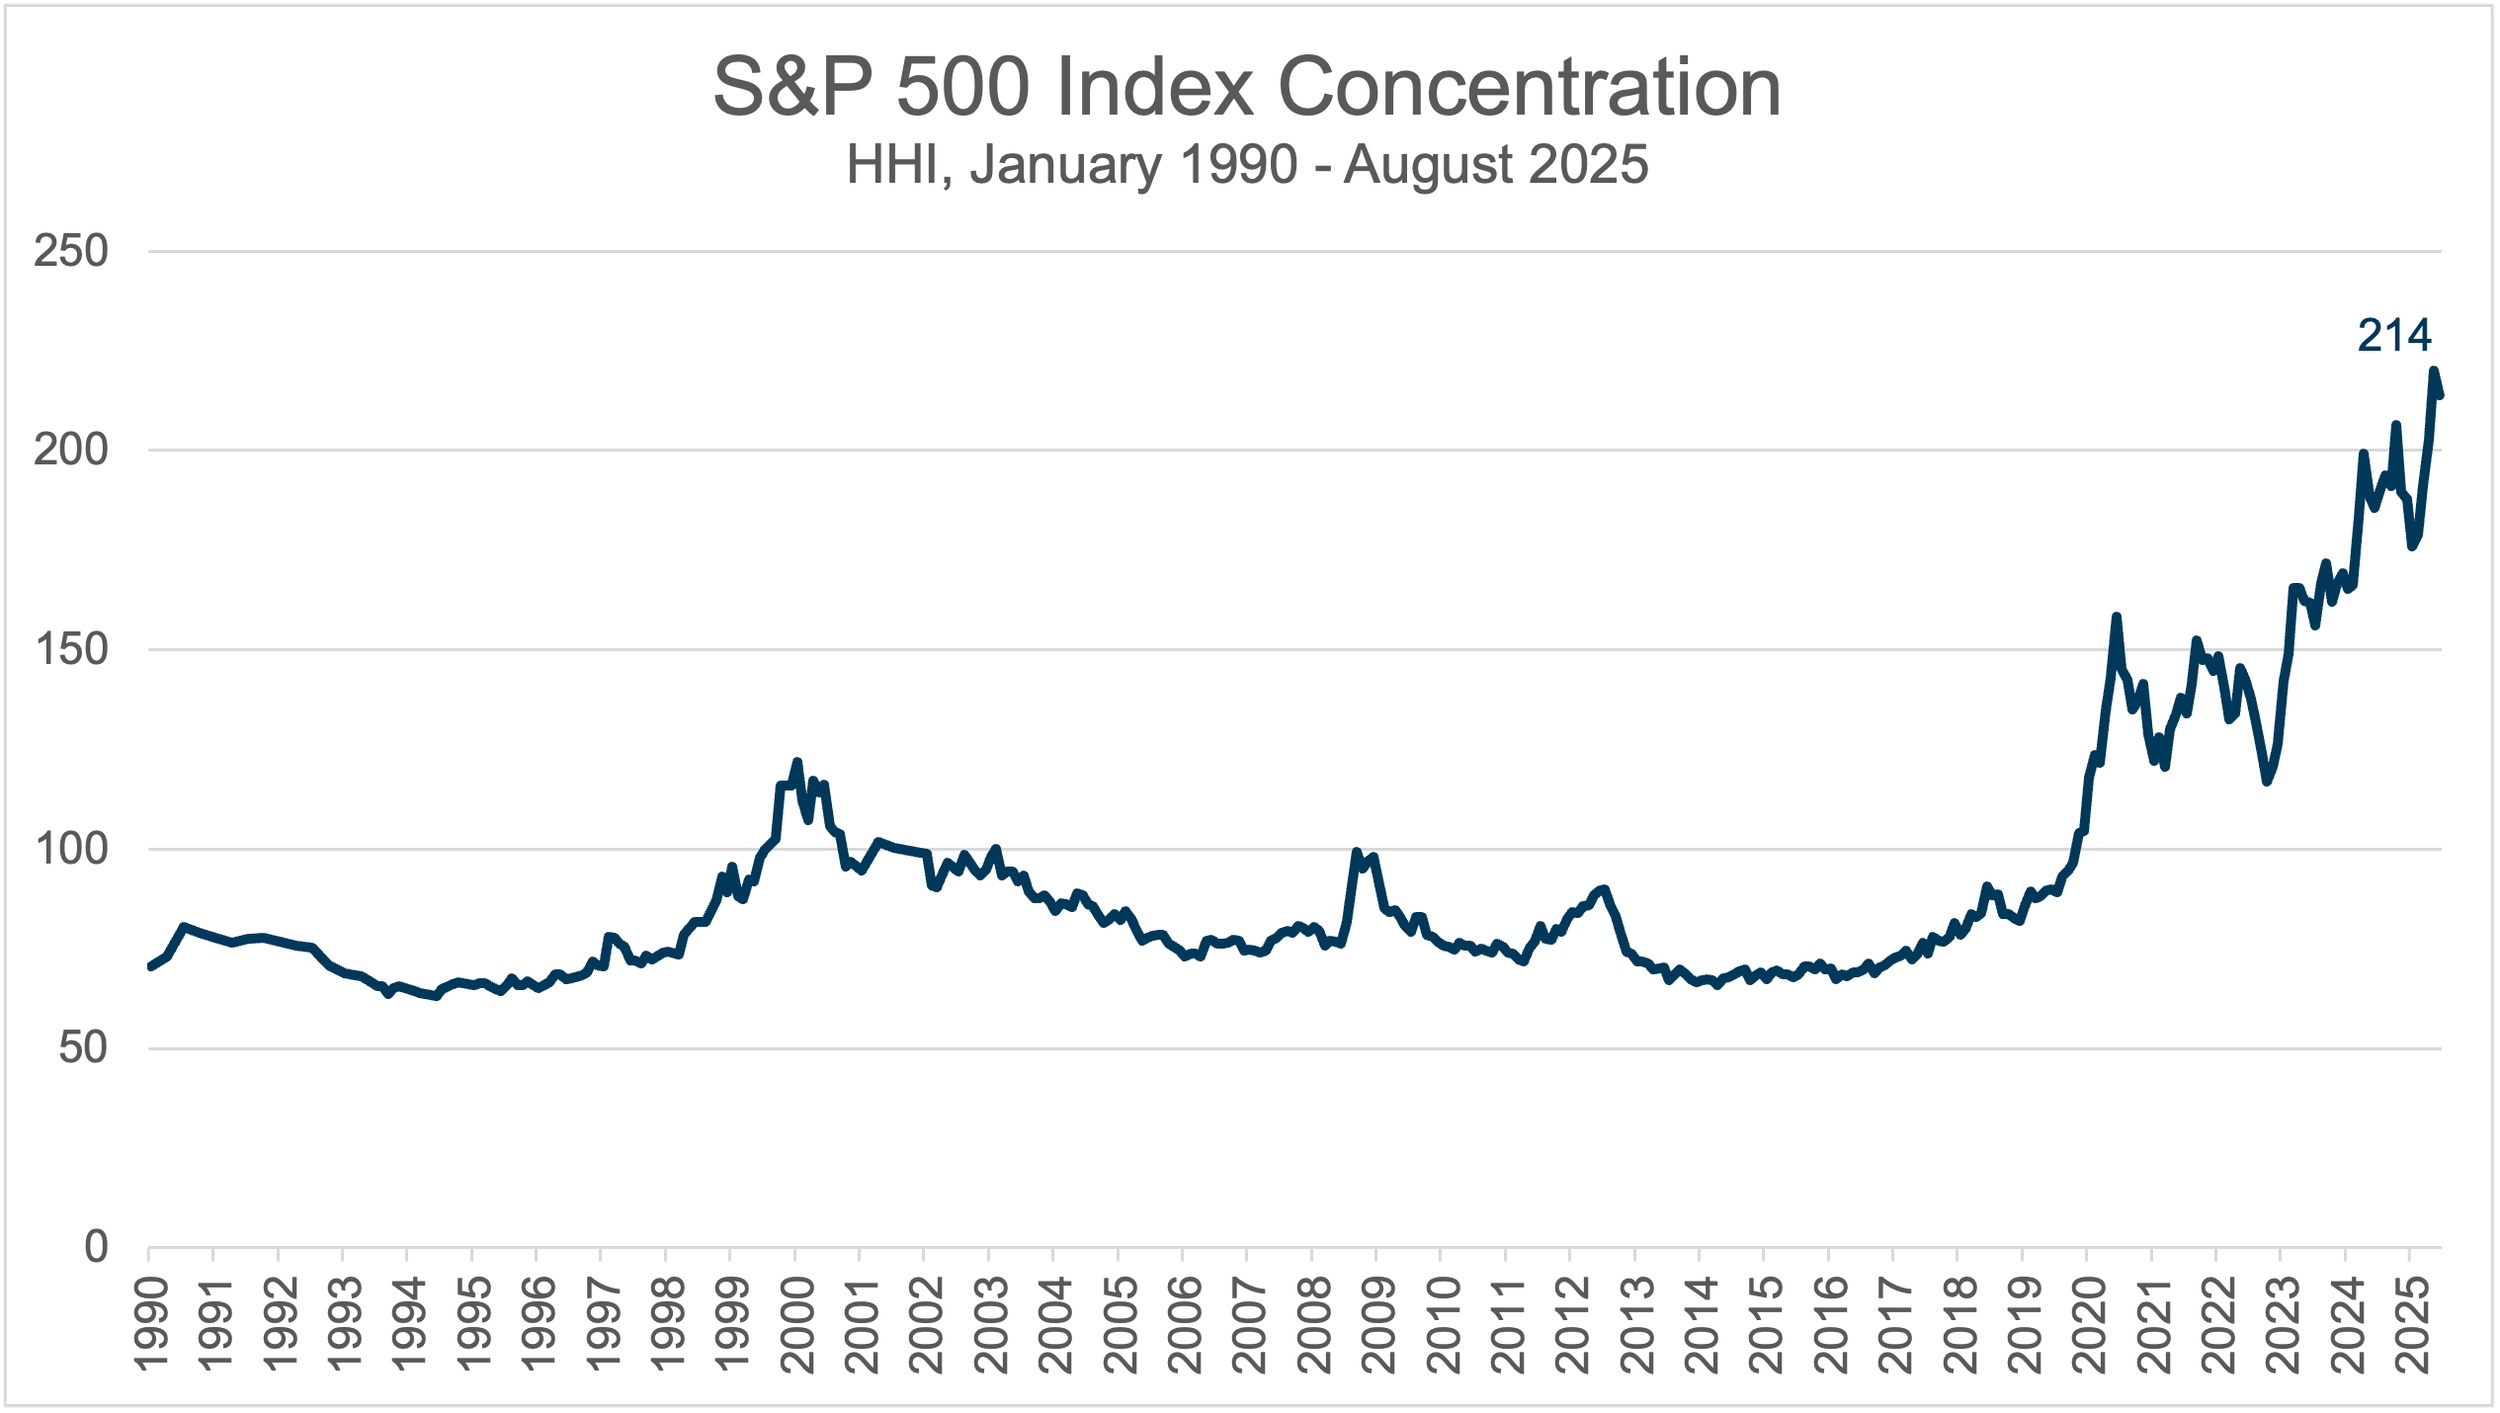
Source: Morningstar. Market concentration is measured by the Herfindahl–Hirschman Index (HHI), which in this case is calculated by squaring the market share of each firm in the S&P 500 index and then summing the resulting numbers. See Important Disclosure Information.
Important Disclosure Information:
1 US Stocks are represented by the S&P 500 index, which includes 500 leading U.S. listed companies, covering approximately 80% of available market capitalization. International Developed stocks are represented by the MSCI World ex USA Net Return USD Index, which covers approximately 85% of the free float-adjusted market capitalization in each of 22 of 23 developed markets countries - excluding the USA. Emerging Markets stocks are represented by the MSCI Emerging Markets Net Return USD, which covers approximately 85% of the free float-adjusted market capitalization in each of 24 emerging markets countries. Data from Morningstar.
There is no guarantee investment strategies will be successful. Past performance is no guarantee of future results. Diversification neither assures a profit nor guarantees against a loss in a declining market.
Indices are not available for direct investment. Index performance does not reflect the expenses associated with management of an actual portfolio. Index performance is measured in US dollars. The index performance figures assume the reinvestment of all income, including dividends and capital gains.
MarketPlus® Investing models consist of institutional quality registered investment companies. Investment values will fluctuate, and shares, when redeemed, may be worth more or less than original cost.
Advisory services are provided by SJS Investment Services, a registered investment advisor (RIA) with the SEC. Registration does not imply a certain level of skill or training. SJS Investment Services does not provide legal or tax advice. Please consult your legal or tax professionals for specific advice.