
Roaring Returns: 2025 Market Recap and Outlook
By Chief Investment Officer Tom Kelly, CFA
2025 closed out with global stock markets delivering another remarkable year, capping one of the strongest three-year stretches in stock market history. The April correction now feels like a distant memory as tariff shocks came and went. Artificial intelligence continues to dominate headlines, alternating between groundbreaking advances and frustrating hallucinations. Worst-case concerns about persistent inflation and rising unemployment ultimately faded. As a result, global stock markets rewarded investors for sticking through all of this.
For the US, the S&P 500 Index surged another 18%, bringing its cumulative three-year return to an astonishing 86% (26% in 2023 and 25% in 2024), nearly double the median for similar periods since 1937. Combined with the S&P 500 doubling from 2019 through 2021, it’s easy to see why talk of the “Roaring 20s” has resurfaced, 2022 notwithstanding.
International stocks added more than 31%, and US bonds posted just over 7%, showing that diversification worked across asset classes.
As we look ahead, the party may continue or it may pause. Either way, our commitment remains the same: building resilient, globally-diversified portfolios tailored to your unique goals. Markets will shift, but our focus on discipline and adaptability helps to ensure we’re ready for whatever comes next. Aiming to deliver not just returns, but something even more valuable: peace of mind.
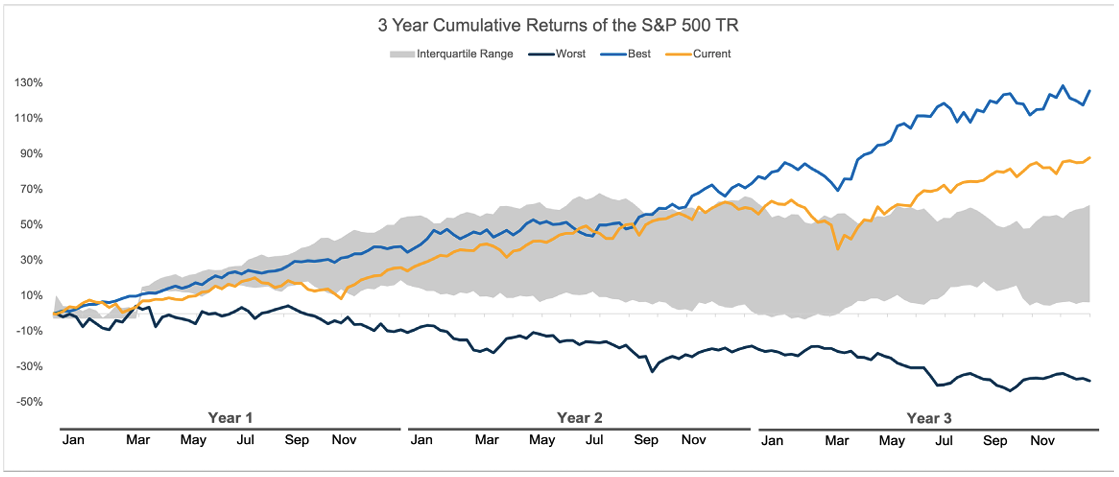
Sources: SJS Investment Services, Morningstar. The US stock market is represented by the S&P 500 Total Return Index. Portfolios were ranked each month based on their position within the S&P 500 universe for the time period from 1937 through 2025 and then assigned to discrete quartile groups (bottom quartile, median, top quartile) using non-interpolated breakpoints. Each breakpoint corresponds to the rank of the nearest actual portfolio in the ordered distribution (i.e., no linear interpolation between portfolios). The current returns represent the time frame from 01/01/2023 to 12/31/2025. Best represents the time frame from 01/01/1995 - 12/31/1997. Worst represents the time period from 01/01/2000 - 12/31/2002. Indices are not available for direct investment. Index performance does not reflect the expenses associated with management of an actual portfolio. Index performance is measured in US dollars and assumes reinvestment of all distributions. See Important Disclosure Information.
Important Disclosure Information & Sources:
US stocks are represented by the S&P 500 TR Index, which is a market capitalization‑weighted index that measures the performance of 500 leading large‑cap U.S. companies and covers roughly 80% of the U.S. equity market.
International stocks are represented by the MSCI All Country World ex USA IMI Index (Net Div.), which covers approximately 99% of the global equity opportunity set outside the US.
US bonds are represented by the Bloomberg U.S. Aggregate Bond Index, which is a market value-weighted index for U.S. dollar denominated investment-grade fixed-rate debt issues.
There is no guarantee investment strategies will be successful. Past performance is no guarantee of future results. Diversification neither assures a profit nor guarantees against a loss in a declining market.
Indices are not available for direct investment. Index performance does not reflect the expenses associated with management of an actual portfolio. Index performance is measured in US dollars. The index performance figures assume the reinvestment of all income, including dividends and capital gains.
Advisory services are provided by SJS Investment Services, a registered investment advisor (RIA) with the SEC. Registration does not imply a certain level of skill or training. SJS Investment Services does not provide legal or tax advice. Please consult your legal or tax professionals for specific advice.
MarketPlus® Investing models consist of institutional quality registered investment companies. Investment values will fluctuate, and shares, when redeemed, may be worth more or less than original cost.