
Don’t Let Bubble Talk Burst Your Plan
By Investment Analyst Elizabeth Molique
Are valuations excessively high? Do record earnings justify selling?
Headlines that stir fear are not new. Investors often get caught up in market noise, but recognizing that news headlines are often written to prioritize clicks over nuanced truth can reduce stress. Many studies have found that fear motivates human behavior far more powerfully than the compelling weight of historical evidence.[1] Behavioral research, including prospect theory, finds that investors tend to dislike losing money more than they enjoy gaining the same amount, so a loss feels more intense than an equal-sized gain.[2] Worry sells!
Recently, talk of an “AI bubble” has intensified as technology stock valuations stretch, volatility swings, and concentration builds. We understand this worry, and want to discuss what a bubble is, the history of bubbles within stock markets, and what this means for your portfolio.
As we detail below, it is very difficult to successfully time both the peak and the bottom of any investment bubble. What we do know is that long-term investors can benefit from discipline, diversification, and a focus on evidence-based principles.
There are varying definitions of a bubble. One definition that we find particularly compelling is provided by the author William Bertstein. In his book The Four Pillars of Investing: Lessons for Building a Winning Portfolio, Bernstein – building off of the work of economist Hyman Minsky – details four necessary conditions for a bubble: 1. A major technological revolution or shift in financial practice; 2. Liquidity - easy credit; 3. Amnesia for the last bubble; 4. Abandonment of time-honored methods of security valuation.[3]
Applying these conditions to historical examples of investment bubbles, the economist Robert Shiller – in his book Irrational Exuberance – describes a bubble as a situation where “news of price increases spurs investor enthusiasm, which spreads by psychological contagion…bringing in a larger and larger class of investors, who, despite doubts about the real value of an investment, are drawn to it partly through envy of others’ successes and partly through a gambler’s excitement.”[4]
History suggests bubbles form when stock or asset prices rise rapidly without enough fundamental support, often as new companies and capital flood a sector due to breakthrough technology. Prices then overstate value by anticipating shorter-term cash flows unlikely to occur. When investors begin acting on the belief that prices are detached from underlying company fundamentals, negative and bearish views start to form, and the bubble is said to “pop”. When a bubble “pops,” stock prices may fall rapidly in a crash or may manifest in years of underperformance. Examples of the latter include when stock prices fell over the span of a few years during the Dot-Com Bubble as well as the Great Depression. During the Dot-Com Bubble, prices rose rapidly until March of 2000, when prices started to fall. The S&P 500 Index fell nearly 45% from September 2000 through September 2002, with information technology stocks within the index falling significantly more.[5]

Sources: SJS Investment Services, Morningstar as of December 31, 2025. The S&P 500 Information Technology Index comprises those companies included in the S&P 500 that are classified as members of the GICS® information technology sector. The index performance figures assume the reinvestment of all income, including dividends and capital gains. Past performance is no guarantee of future results. See Important Disclosure Information.
High valuations alone do not indicate a bubble. Price appreciation is part of a bubble, but there must also be a surge in valuations that - at least in the short term - overestimate companies’ potential cash flows from technological breakthroughs. Distinguishing bubbles from normal market behavior is crucial. As the chart below details, new stock market highs have been much more common than bubbles.[5] Market runs can last for years and reach staggering heights. Without a clear definition, identifying when a bubble truly exists seems elusive. Investments, by their nature, are unpredictable!
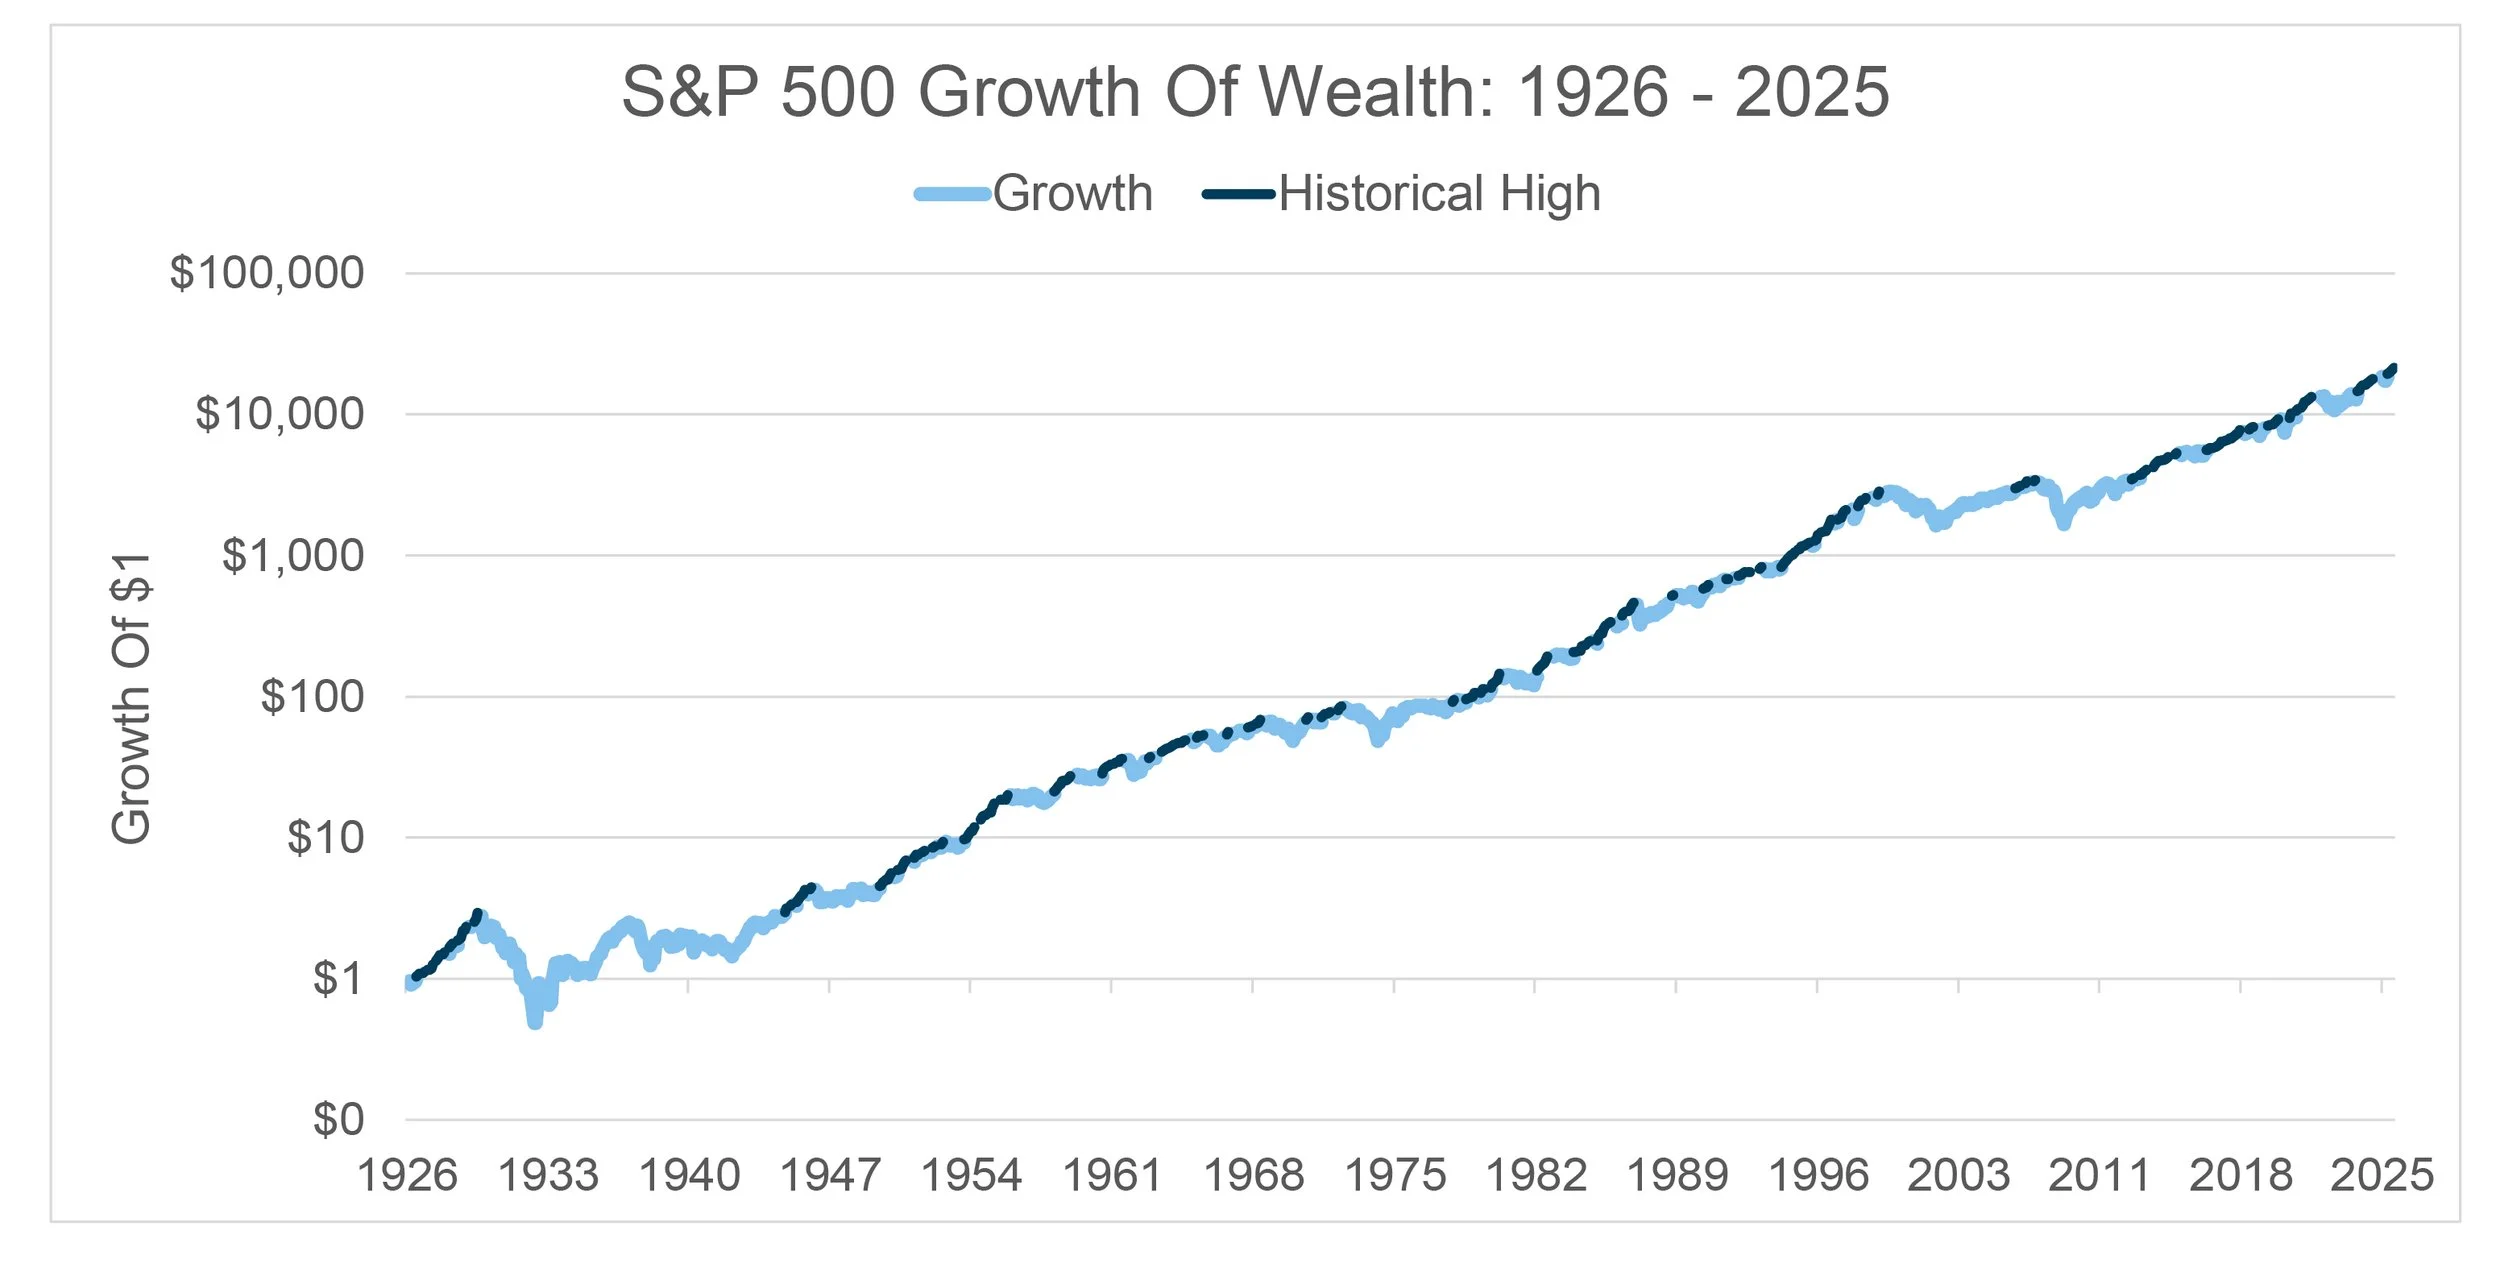
Sources: SJS Investment Services, Morningstar as of December 31, 2025. The S&P 500 Index is a free float-adjusted market-capitalization-weighted index of 500 of the largest publicly traded companies in the United States. The index performance figures assume the reinvestment of all income, including dividends and capital gains. Past performance is no guarantee of future results. See Important Disclosure Information.
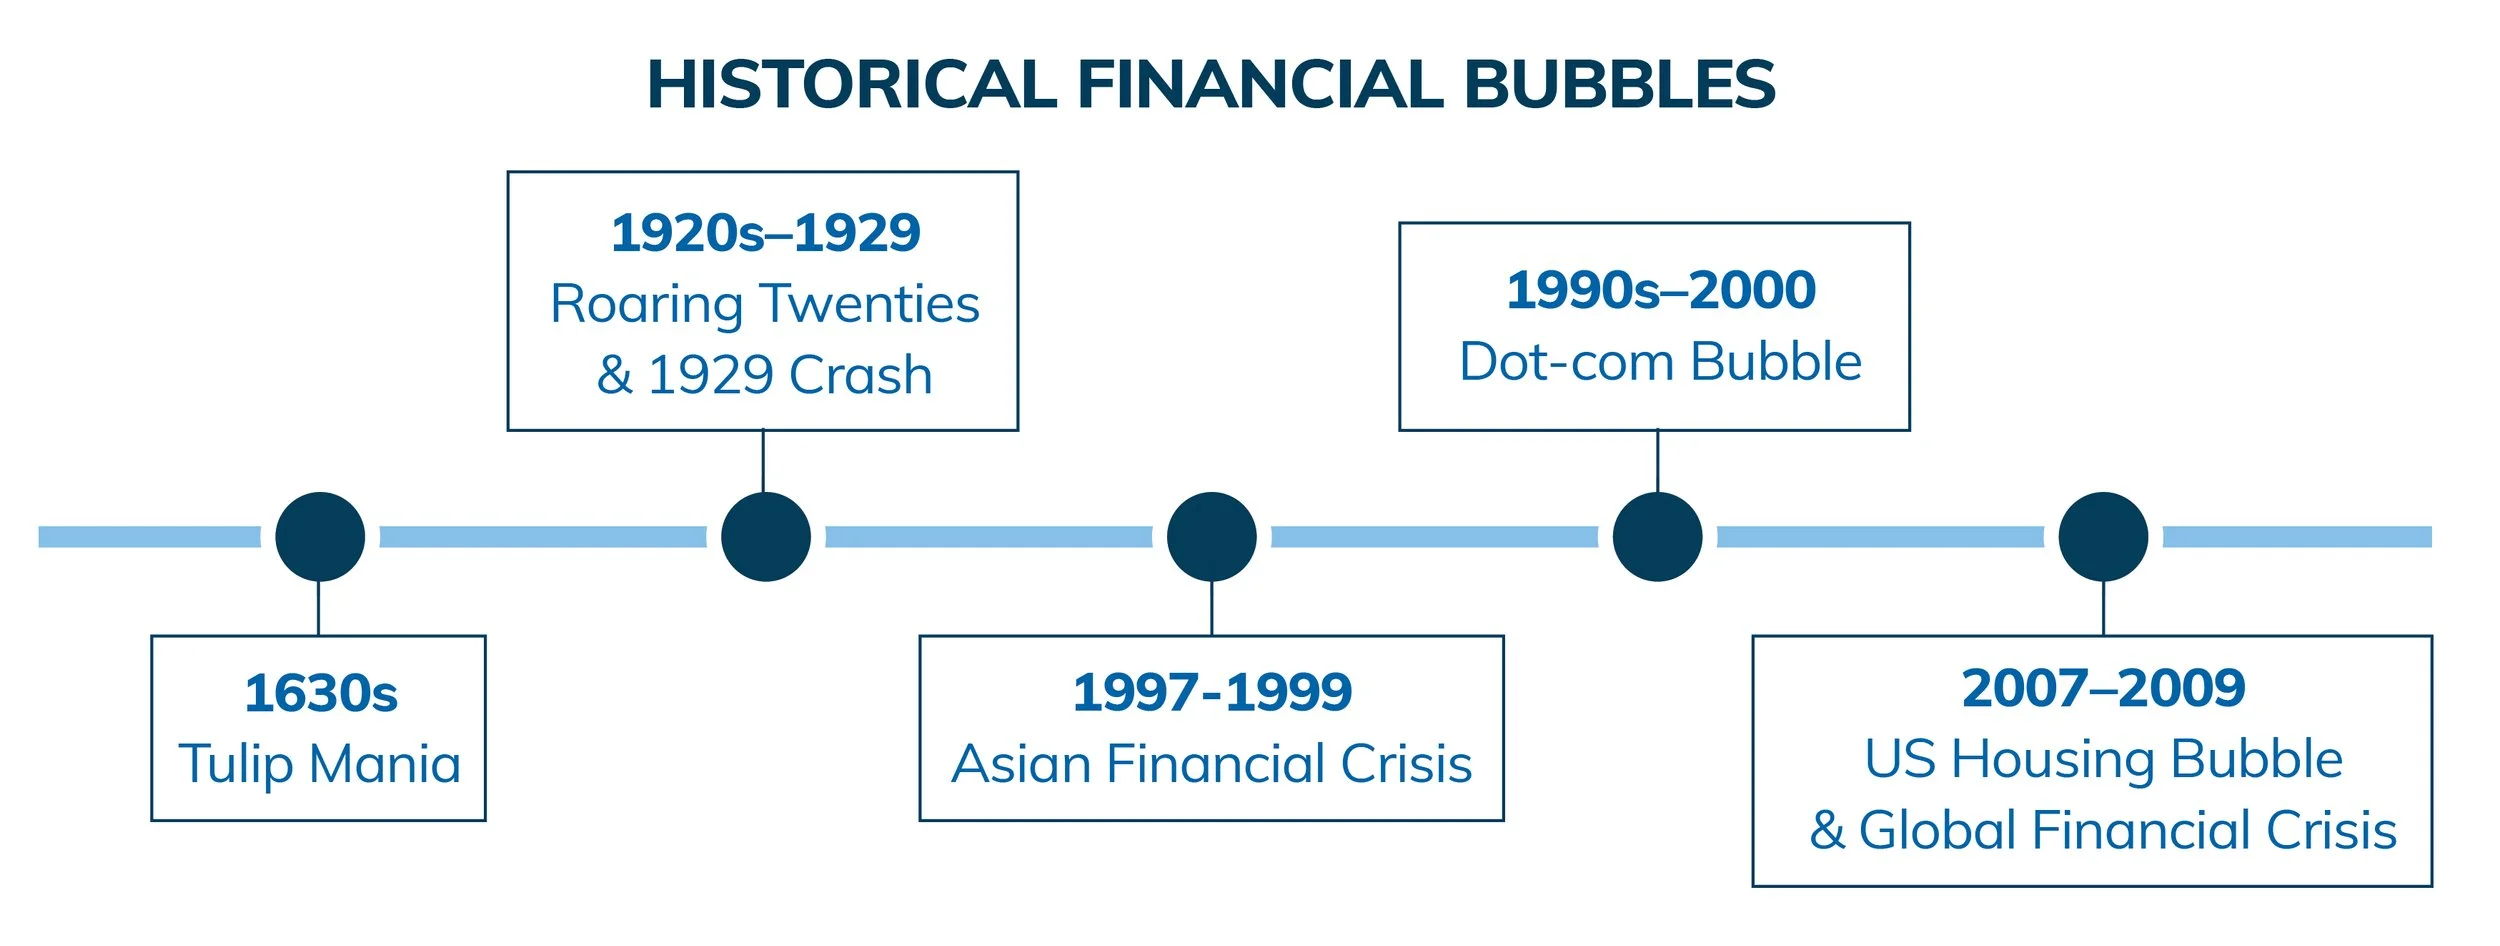
Bubbles have existed since humans have engaged in large-scale commerce and conjecture. Tulip Mania in the Netherlands in the 1630s is an example of an early bubble. Rare tulip bulbs became extremely overvalued and started selling for extraordinary prices, sometimes selling for the value of luxury homes, before collapsing almost overnight.[6]
A few centuries later, history reminded us again that exuberance can outpace reality. During the Roaring Twenties, soaring optimism and rapid economic growth fueled a stock market boom that seemed unstoppable. That illusion ended abruptly with the 1929 crash, emphasized by when the Dow Jones Industrial Average Index fell over 12% on Black Monday (October 28, 1929), sending shock waves through the U.S. and global economies throughout the Great Depression.[7]
The late twentieth century brought fresh versions of the same story. The Asian Financial Crisis of 1997–1999 spread rapidly across East and Southeast Asia, exposing fragile financial systems and igniting severe recessions.[8] Soon after, the Dot-Com Bubble of the late 1990s pushed technology stocks to unsustainable valuations for the time, only for many companies’ stock prices to collapse in the early 2000s.
Even more recent history offers a cautionary tale. The U.S. housing bubble of the mid-2000s, fueled by easy credit and risky speculation, burst in 2007–2009, triggering the Global Financial Crisis.[9] The impact was felt across markets worldwide. From November 2007 through March 2009, global stocks fell over 50%, needing until 2013 to recover.[10]
Today’s global market data allows us to compare how past bubbles formed and spread across economies, helping investors to potentially recognize bubbles forming. However, even with more information, it is easy for investors to misjudge their timing. Markets rise and fall unpredictably, and no one can forecast the future with certainty; claims otherwise are warning signs. Attempting to time or bet against these cycles is a form of speculation, and speculative strategies have historically underperformed disciplined, long-term investing approaches.[11]
Additionally, studies consistently show that investors who chase individual stocks or react to short-term market swings tend to underperform over time.[11] Market volatility can tempt action, but reacting impulsively to fluctuations can undermine long-term goals. In our experience, the most reliable outcomes come from maintaining discipline and following a clear, evidence-based process rather than letting emotions drive decisions.
At SJS, we view investing as a thoughtful, evidence-based process designed to balance opportunity and risk, not as a game of chance. Our approach spans global markets and multiple asset classes, enabling clients to participate in areas of innovation, such as AI, while maintaining diversification that can help cushion against potential bubbles. We use systematic rebalancing as a core risk management tool; our process is designed to systematically capture upside during price rises while trimming concentrated positions to avoid excessive exposure to a single stock, geography, or sector.
For clients worried about overexposure to specific sectors amid potential AI bubbles, we help evaluate options that keep their portfolios aligned with long-term goals while managing risk thoughtfully. We think that the existence, or fear, of a bubble should not drive drastic short-term decisions. Our MarketPlus® Investing process is built on the belief that investors should stay diversified, remain humble amid uncertainty, and commit to a long-term, evidence-based strategy. Long-term investing is challenging, but price speculation and prediction has proven even harder historically. In our experience, true success comes not from chasing bubbles, but from staying disciplined and letting time and the markets work for you.
Important Disclosure Information & Sources:
[1] Stocks for the Long Run (3rd Edition). Jeremy Siegel, 2002, McGraw-Hill.
[2] Thinking, Fast and Slow. Daniel Kahneman, 2013, Farrar, Straus and Giroux.
[3] The Four Pillars of Investing: Lessons for Building a Winning Portfolio. William J. Bernstein, 2010, McGraw Hill.
[4] Irrational Exuberance: Revised and Expanded Third Edition. Robert J. Shiller, 2016, Princeton University Press.
[5] Source: Morningstar. The S&P 500 Index is a free float-adjusted market-capitalization-weighted index of 500 of the largest publicly traded companies in the United States. The index performance figures assume the reinvestment of all income, including dividends and capital gains.
[6] Extraordinary Popular Delusions and The Madness of Crowds. Charles MacKay, 2011, CreateSpace Independent Publishing Platform.
[7] “The Great Depression”. Federal Reserve Bank of St. Louis, 2013, federalreservehistory.org. The Dow Jones Industrial Average® (The Dow®), is a price-weighted measure of 30 U.S. blue-chip companies.
[8] “Asian Financial Crisis”. Federal Reserve Bank of St. Louis, 2013, federalreservehistory.org.
[9] “The Great Recession and Its Aftermath”. Federal Reserve Bank of St. Louis, 2013, federalreservehistory.org.
[10] Source: Morningstar. The MSCI ACWI Investable Market Index (IMI) captures large, mid and small cap representation across Developed Markets and 24 Emerging Markets countries, representing approximately 99% of the market capitalization in each country. The index performance figures assume the reinvestment of all income, including dividends and capital gains.
[11] “Unconventional Success: A Fundamental Approach to Personal Investment”. David Swensen, 2005, Free Press.
Past performance does not guarantee future results. Diversification neither assures a profit nor guarantees against a loss in a declining market. There is no guarantee investment strategies will be successful.
Indices are not available for direct investment. Index performance does not reflect the expenses associated with management of an actual portfolio. Index performance is measured in US dollars.
MarketPlus® Investing models consist of registered investment companies. Investment values will fluctuate, and shares, when redeemed, may be worth more or less than original cost.
Statements contained in this article that are not statements of historical fact are intended to be and are forward looking statements. Forward looking statements include expressed expectations of future events and the assumptions on which the expressed expectations are based. All forward looking statements are inherently uncertain as they are based on various expectations and assumptions concerning future events and they are subject to numerous known and unknown risks and uncertainties which could cause actual events or results to differ materially from those projected.