

Do SPACs Deserve Our Blank Checks?
A SPAC is a publicly traded company that raises money from investors with the intent of taking some not-yet-determined private company public. Like giving your child a blank check to go buy whatever they want. What could go wrong?
By SJS Investment Services Chief Investment Officer Tom Kelly, CFA.
“What do you mean I don’t have any more money in my bank account? I have all these blank checks!”
I was reminded of this oft-quoted family teaching moment on the value of a blank check (the speaker of which will remain anonymous) when I first heard about SPACs. Special-purpose acquisition companies (SPACs), sometimes referred to as “blank check” companies, offer an alternative to the traditional Initial Public Offering (IPO) process of taking a company from private to public. A SPAC is a publicly traded company that raises money from investors with the intent of taking some not-yet-determined private company public. Like giving your child a blank check to go buy whatever they want. What could go wrong?
A SPAC is created by a sponsor (often of celebrity status) which issues publicly tradeable shares (typically $10 per share) in exchange for investor money. Once enough money is raised, the sponsor searches for a target company to acquire. The investors often have little idea what company will be acquired, or even if there is a targeted industry. After the SPAC finds a private company and completes a SPAC IPO, then the shares of the SPAC merge into the shares of the new publicly traded company. For their efforts, the sponsor typically receives 20% of the new publicly traded company’s post-SPAC IPO common shares (known as the promote). However, if a SPAC IPO is not completed within two years, then usually the SPAC is liquidated and investors get their money back.
SPACs are not new, but they have received notoriety as of late. There were 248 SPAC IPOs in 2020 raising $83 billion, and 288 deals with over $93 billion in proceeds so far in 2021 (through March 23). In contrast, there were 226 SPAC IPOs raising $47 billion total from 2009-2019.[1]
Compared to traditional IPOs, the potential benefits of SPAC IPOs include:
For the private company, a typically faster public listing from the merger announcement to completion.
For the private company, usually greater certainty regarding IPO money raised.
For investors, purported access to private companies which the average investor would not typically have access to.
On the flip side, investors do not know what the investment will be, so there is a high opportunity cost in waiting for a deal to be announced since the invested funds are typically sitting in an escrow account. Sponsors are incentivized to do a deal to receive the promote, even when private companies are expensive.
So, does giving a sponsor a blank check pay off? While there is a wide dispersion of results and a relatively limited dataset, the results are not pretty. From 2019 through early 2020, SPACs had both negative average and median returns in the 3-month, 6-month, and 1-year periods following the completion of a merger; SPACs had worse returns than both the Renaissance IPO Index and Russell 2000 Small Cap Index over all respective periods.[2]

Source: “A Sober Look at SPACs“. Michael Klausner, Michael Ohlrogge, & Emily Ruan, 16-Nov-2020, ssrn.com. Avantis Investors. Data reflects the 2019-2020 merger cohort. Of the 47 SPACs examined, 47 had sufficient history for the three-month period, 38 for the six-month period and 16 for the 12-month period. The IPO Index is the Renaissance IPO Index. The Small Cap Index is the Russell 2000 Index. See Important Disclosure Information.[2]
On the other hand, the SPAC sponsors - which receive the promote - have been rewarded handsomely, with an average 1-year return of 187% and median 1-year return of 32% for sponsors.[2] SPACs appear to be a much better “investment” for sponsors rather than the investors. In an effort to highlight potential risks for investors, the SEC has done the following:
December 2020: Issued guidance regarding SPACs, identifying potential conflicts of interest and disclosure concerns related to SPAC IPOs and subsequent transactions.[3]
March 2021: Issued an Investor Alert that states, “Never invest in a SPAC based solely on a celebrity’s involvement or based solely on other information you receive through social media, investment newsletters, online advertisements, email, investment research websites, internet chat rooms, direct mail, newspapers, magazines, television, or radio.“[4]
March 2021: Has opened an inquiry into SPACs and is seeking information on how underwriters are managing the risks involved.[5]
Investor beware.
So before investing in the next hot SPAC deal, it may be wise to reconsider who you are giving your blank check to. We think that most investors would instead be better off over the long-term using a science-based, low-cost, broadly-diversified investing strategy such as MarketPlus Investing®.
If you have any questions about SPACs or your investments, please reach out to us. We are happy to listen and assist.
Important Disclosure Information And Sources:
[1] “SPAC Statistics“. SPACInsider, 23-Mar-2021, spacinsider.com.
[2] “A Sober Look at SPACs“. Michael Klausner, Michael Ohlrogge, & Emily Ruan, 16-Nov-2020, ssrn.com. The Renaissance IPO Index® (IPOUSA) is a stock market index based upon a portfolio of U.S.-listed newly public companies that includes securities prior to their inclusion in core U.S. equity portfolios. The Russell 2000 Index measures the performance of the 2,000 smaller companies that are included in the Russell 3000 Index, which itself is made up of nearly all U.S. stocks.
[3] “Special Purpose Acquisition Companies: CF Disclosure Guidance: Topic No. 11“. U.S. Securities and Exchange Commission, 22-Dec-2020, sec.gov.
[4] “Celebrity Involvement with SPACs – Investor Alert“. U.S. Securities and Exchange Commission, 10-Mar-2021, sec.gov.
[5] “U.S. regulator opens inquiry into Wall Street's blank check IPO frenzy“. Jody Godoy & Chris Prentice, 24-Mar-2021, reuters.com.
There is no guarantee investment strategies will be successful. Past performance is no guarantee of future results. Diversification neither assures a profit nor guarantees against a loss in a declining market.
Statements contained in this report that are not statements of historical fact are intended to be and are forward looking statements. Forward looking statements include expressed expectations of future events and the assumptions on which the expressed expectations are based. All forward looking statements are inherently uncertain as they are based on various expectations and assumptions concerning future events and they are subject to numerous known and unknown risks and uncertainties which could cause actual events or results to differ materially from those projected.
Advisory services are provided by SJS Investment Services, a registered investment advisor (RIA) with the SEC. Registration does not imply a certain level of skill or training. This material has been prepared for informational purposes only.
MarketPlus Investing® models consist of institutional quality registered investment companies. Investment values will fluctuate, and shares, when redeemed, may be worth more or less than original cost.
Hyperlinks to third-party information are provided as a convenience and we disclaim any responsibility for information, services or products found on websites or other information linked hereto.
Suggested Reading

What Do Millionaires Do Differently?
The typical millionaire may surprise you. I think these characteristics and actions tend to help people grow their wealth over time.
By SJS Investment Services Founder & CEO Scott Savage.
When you hear the word “millionaire“, what pops into your head? It may be a picture of Elon Musk. Or maybe an upward stock market chart. Or even a Wall Street trading floor.
And yet, the typical millionaire may surprise you. In the book The Millionaire Next Door: The Surprising Secrets Of America’s Wealthy, first written in 1996 and updated in 2010, authors Thomas Stanley and William Danko studied who are the millionaires within the United States and how they have become millionaires. They identify seven common denominators among people who successfully build wealth:[1]

None of these traits surprises me. I have repeatedly seen our clients exhibit these traits over the past 25+ years. We work with people from all sorts of different backgrounds with all sorts of experiences. In addition to the traits above, I think the below characteristics and actions tend to help clients grow their wealth over time:
They adjust their lifestyle to save money each year.
They come from all sorts of occupations, and many don’t make make large salaries, yet they almost always figure out a way to save some money each year.
They prepare for adversity.
Most have an emergency fund that gives them the confidence to survive unexpected job loss, health problems, or financial adversity. They have necessary insurance - such as health, disability, umbrella, and life insurance - to protect themselves and their families in case of unexpected events. Additionally, they ensure their important life documents are updated - including wills, trust documents, healthcare POA, and advance directives.
They have a larger goal for their wealth.
They are motivated to do something meaningful with their wealth, such as providing for their family as well as donating to charitable causes.
They focus on the long-term.
They know it may take decades for them to become millionaires. They create an investment plan that will allow them to not have to focus too much on their investments over the short-term. They know the power of compounding over the long-term, and control what they can while letting markets do the work.
They invest in what they understand.
Most invest in low-cost, broadly-diversified stock and bond mutual funds & ETFs. However, many invest in their businesses, or in certain niches of investing that they know a lot about. They know that if they don’t feel comfortable with their investments, they will probably not stick with the plan.
They don’t pay too much for their investments.
While there isn’t one right way to invest, there are many ways to lose wealth. Paying more than you need to for investments is one of them.
They continuously learn about the world.
They know the world is always changing, and they need to continuously learn and evolve to keep up.
They rely on advisors when they need to.
When they don’t know something or can’t put in the time, they work with advisors - such as accountants, financial advisors, and estate-planning experts - to accomplish their goals.

More than 90% of high net-worth families lose the family wealth after three generations.[2] My hope is that if we can better listen, understand, create strategies, and implement plans to help people invest better, then more people will be able to achieve their goals, and pay it forward by helping others along the way.
So the next time you hear the word “millionaire“, I hope the image that pops into your head is your modest, hard-working neighbor.
Important Disclosure Information And Sources:
[1] The Millionaire Next Door: The Surprising Secrets Of America’s Wealthy. Thomas Stanley & William Danko, 2010, Taylor Trade Publishing.
[2] “5 lies you’ve been told about generational wealth.” Pavithra Mohan, 18-Jul-2019, fastcompany.com.
There is no guarantee investment strategies will be successful. Past performance is no guarantee of future results. Diversification neither assures a profit nor guarantees against a loss in a declining market.
Advisory services are provided by SJS Investment Services, a registered investment advisor with the SEC. Registration does not imply a certain level of skill or training. SJS Investment Services does not provide legal or tax advice. Please consult your legal or tax professionals for specific advice. This material has been prepared for informational purposes only.
Statements contained in this report that are not statements of historical fact are intended to be and are forward looking statements. Forward looking statements include expressed expectations of future events and the assumptions on which the expressed expectations are based. All forward looking statements are inherently uncertain as they are based on various expectations and assumptions concerning future events and they are subject to numerous known and unknown risks and uncertainties which could cause actual events or results to differ materially from those projected.
Hyperlinks to third-party information are provided as a convenience and we disclaim any responsibility for information, services or products found on websites or other information linked hereto.
Suggested Reading

Should You Convert Your IRA To A Roth IRA?
Depending on individual circumstances, some people consider converting their Traditional IRA to a Roth IRA in an effort to increase longer-term after-tax returns.
By SJS Investment Services Senior Advisor Andrew Schaetzke, CFP®.
Taxes may be one of your most important considerations in the design and implementation of your investment strategy. We want to help you increase after-tax returns, subject to your particular investment plan.
When you have some combination of taxable, tax-deferred, and tax-exempt investment accounts, assuming the same investments, we expect your after-tax returns to be higher for tax-advantaged (tax-deferred and tax-exempt) accounts compared to taxable accounts.
One specific tax-advantaged account - the Individual Retirement Account (IRA) - has an important feature that can potentially help you increase your after-tax expected returns over time.
Individual Retirement Accounts (IRAs): Traditional IRA Vs. Roth IRA
An IRA is meant to help people save for retirement in a tax-efficient way. There are two types of IRAs:[1]
Traditional IRA: As long as your taxable income (MAGI) is not above the Traditional IRA deduction limit, the money you put into the account is not taxed and may be deducted from your income up to $6,000 in 2021 ($7,000 if over age 50). When you withdraw money from the account at a later date, it is taxed at ordinary income tax rates.
Roth IRA: As long as your taxable income (MAGI) is lower than the Roth IRA income limit, the money you put into the account is taxed now with no deduction. The money taken out of the account at a later date after age 59 1/2 is not taxed at all.
For a more thorough explanation of Traditional IRAs and Roth IRAs, please see this IRS website.
Converting A Traditional IRA To A Roth IRA
Depending on your individual circumstances, you may consider converting your Traditional IRA to a Roth IRA in an effort to increase your longer-term after-tax expected returns. As part of the process, you have to pay federal & state income taxes now on the amount of money that you convert. There are many reasons you may consider converting to a Roth IRA, including:
More tax-free withdrawals in retirement
Watch your money potentially grow tax-free longer
Decreasing future tax burden for beneficiaries of your Traditional IRA
You may be a good candidate for a conversion if:
You are paying lower federal & state income tax rates now compared to expected taxes in the future.
You have lower taxable income this year compared to expected future years.
You want to lower the required minimum distributions (RMDs) from the Traditional IRA.
You are interested in lowering your Medicare IRMAA surcharges by decreasing future taxable income (MAGI).
You want to feel more in control of your future tax burden.
For more information on IRA conversions, please see this IRS website.

Risks of Converting A Traditional IRA To A Roth IRA
Rolling over a significant balance to a Roth IRA could put you into a higher income tax bracket and leave you with a bigger tax bill this year. If tax rates decrease in the future, you may end up paying more taxes by converting now relative to in the future. The regulatory rules and income limits surrounding conversions can be complex, and it is easy to make mistakes during the conversion process, which may complicate filing your taxes, potentially lead to the 10% penalty, and could lead to an IRS audit. Assets converted to a Roth IRA must be held in the Roth IRA for at least five years before withdrawing in order to avoid a 10% penalty. Depending on your conversion method, you may not be invested during the conversion period. Additionally, the conversion may cause you unnecessary stress.
Summary
Converting a Traditional IRA to a Roth IRA is highly dependent on your unique circumstances. SJS can help you review your current situations, and analyze the benefits and tradeoffs of conversions. As always, please work with your tax advisor to appropriately complete any IRA conversion and associated paperwork.
IRA conversions are just one of the many ways that SJS helps people potentially increase their after-tax expected returns over time. If you want to learn more about other ways and how SJS may be able to help you, please feel free to reach out to us.
Important Disclosure Information And Sources:
[1] “Traditional and Roth IRAs“. IRS, irs.gov.
[2] “IRA FAQs - Rollovers and Roth Conversions“. IRS, irs.gov.
There is no guarantee investment strategies will be successful. Past performance is no guarantee of future results. Diversification neither assures a profit nor guarantees against a loss in a declining market.
Advisory services are provided by SJS Investment Services, a registered investment advisor with the SEC. Registration does not imply a certain level of skill or training. SJS Investment Services does not provide legal or tax advice. Please consult your legal or tax professionals for specific advice. This material has been prepared for informational purposes only.
Statements contained in this post that are not statements of historical fact are intended to be and are forward looking statements. Forward looking statements include expressed expectations of future events and the assumptions on which the expressed expectations are based. All forward looking statements are inherently uncertain as they are based on various expectations and assumptions concerning future events and they are subject to numerous known and unknown risks and uncertainties which could cause actual events or results to differ materially from those projected.
Hyperlinks to third-party information are provided as a convenience and we disclaim any responsibility for information, services or products found on websites or other information linked hereto.
Suggested Reading

Is Your Cash Keeping Up With Inflation?
Cash management remains vital to both risk mitigation and capital preservation. How can you increase your expected return via cash-like holdings?
By SJS Investment Services Chief Investment Officer Tom Kelly, CFA.
The adage “Cash is King” has been used in investing to highlight the value of holding on to cash to both protect an investor from having to withdraw when the markets are down, as well as the ability to deploy cash and purchase when prices become cheaper. However, over the last decade, with interest rates kept low near the anchoring Fed Funds rate, inflation has outpaced the interest rate on cash, leading to that cash losing its spending power over time.[1]
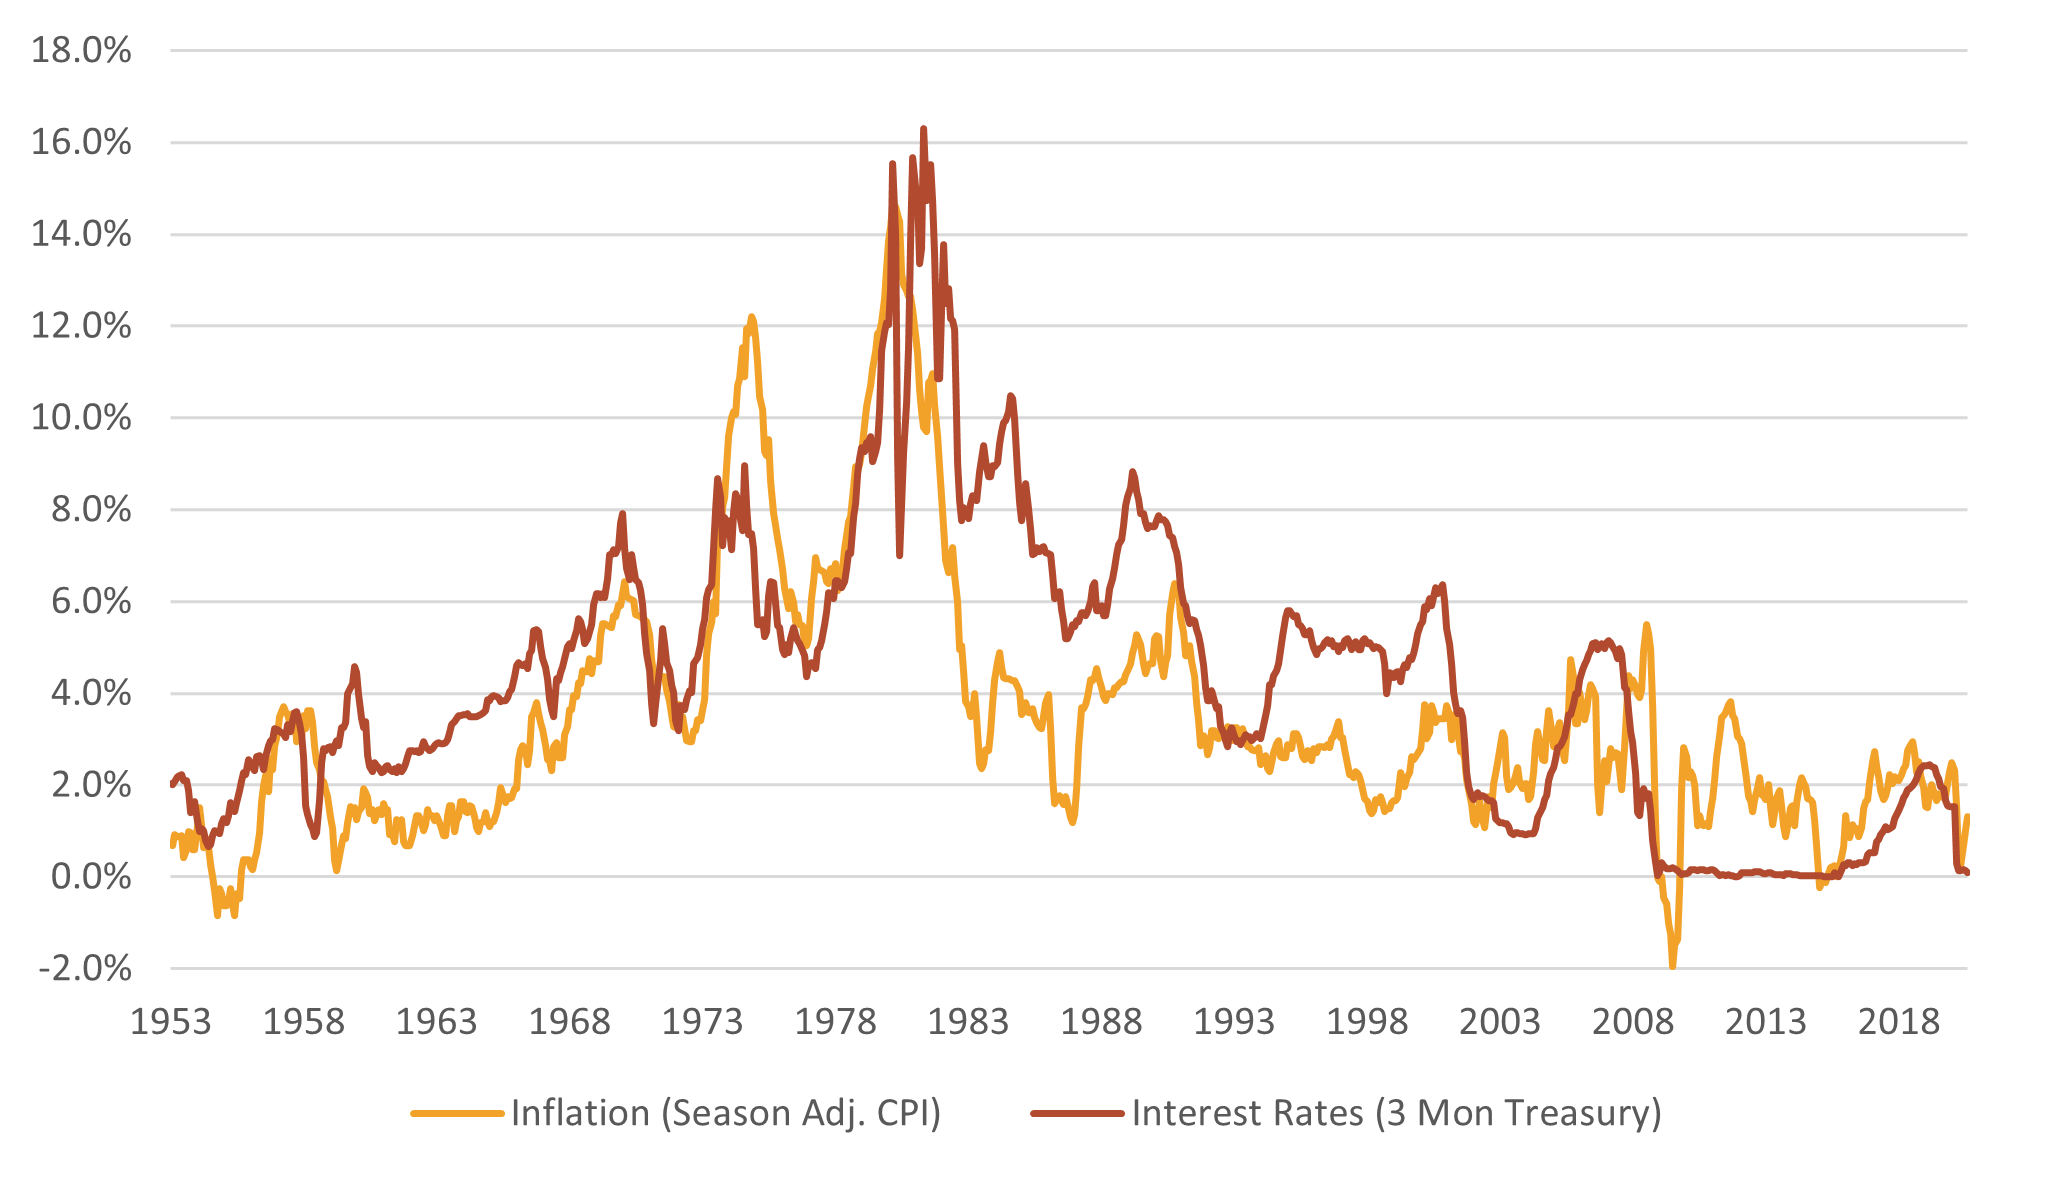
In the US, the erosion of cash value has been greater in recent times than previous periods, with cash trailing inflation since 2009, seen below. We believe this trend is likely to continue, with the Federal Reserve indicating they will continue to keep interest rates near 0%, all the while continuing to provide stimulus to the economy, leading to a 5-Year Breakeven Expected Inflation Rate of 2.35% as of February 23, 2021.[2][3]
Source: Morningstar. Cash represented by the US Treasury T-Bill Secondary Market 3 Month Rates. Inflation represented by the US Bureau of Labor Statistics Consumer Price Index All Urban Seasonally Adjusted Index. See Important Disclosure Information.[4]
Cash management remains vital to both risk mitigation and capital preservation. How can you increase your expected return via cash-like holdings? Online banks sometimes offer higher savings account interest rates than traditional banks due to their lower fixed physical costs. Depending on the holding time horizon, cash alternatives may include Treasury Inflation-Protected Securities (TIPS) or other higher-quality short-term bonds. Furthermore, both real estate and stocks have historically significantly outperformed inflation over the long-term, though they typically add significantly more volatility over the short-term.[5]

Prudent cash management can add incremental value to your overall portfolio investment return. If you have any questions regarding your cash management, please feel free to reach out to us.
Important Disclosure Information And Sources:
[1] “How Inflation Affects Your Savings Account.“ Justin Pritchard, 07-Jan-2021, thebalance.com.
[2] “Powell Pledges to Maintain Fed’s Easy-Money Policies Until Economy Recovers.” Paul Kiernan, 24-Feb-2021, wsj.com.
[3] “5-Year Breakeven Inflation Rate.” Federal Reserve Bank of St. Louis, 23-Feb-2021, fred.stlouis.org. The breakeven inflation rate represents a measure of expected inflation derived from 5-Year Treasury Constant Maturity Securities and 5-Year Treasury Inflation-Indexed Constant Maturity Securities. The latest value implies what market participants expect inflation to be in the next 5 years, on average. See Important Disclosure Information.
[4] The US Treasury T-Bill Secondary Market 3 Month Rates are the daily secondary market quotation on the most recently auctioned Treasury Bills for the 13 week maturity for which Treasury currently issues new Bills. Market quotations are obtained at approximately 3:30 PM each business day by the Federal Reserve Bank of New York. The rate at which a Bill is quoted in the secondary market and is based on the par value, amount of the discount and a 360-day year.
The US Bureau of Labor Statistics Consumer Price Index All Urban Seasonally Adjusted is a measure of the average monthly change in the price for goods and services paid by urban consumers between any two time periods. It can also represent the buying habits of urban consumers. This particular index includes roughly 88 percent of the total population, accounting for wage earners, clerical workers, technical workers, self-employed, short-term workers, unemployed, retirees, and those not in the labor force.)
[5] Stocks for the Long Run: The Definitive Guide to Financial Market Returns & Long-Term Investment Strategies. Jeremy Siegel, 2014, McGraw-Hill Education.
There is no guarantee investment strategies will be successful. Past performance is no guarantee of future results. Diversification neither assures a profit nor guarantees against a loss in a declining market.
Advisory services are provided by SJS Investment Services, a registered investment advisor with the SEC. Registration does not imply a certain level of skill or training. This material has been prepared for informational purposes only.
Statements contained in this post that are not statements of historical fact are intended to be and are forward looking statements. Forward looking statements include expressed expectations of future events and the assumptions on which the expressed expectations are based. All forward looking statements are inherently uncertain as they are based on various expectations and assumptions concerning future events and they are subject to numerous known and unknown risks and uncertainties which could cause actual events or results to differ materially from those projected.
Hyperlinks to third-party information are provided as a convenience and we disclaim any responsibility for information, services or products found on websites or other information linked hereto.
Suggested Reading

GameStop Mania: Another Lesson On Short-Term Speculation
We don’t think that growing revenue, growing profits, or undervaluation can adequately explain GameStop’s valuation growth. Instead, we think short-term price speculation explains the majority of the dramatic growth.
By SJS Senior Advisor Andrew Schaetzke, CFP®.
If you invested in GameStop Corporation (Ticker: GME) five years ago, your holding’s growth would probably look something like the below.

Source: Google Finance, as of 29-Jan-2021.
What usually causes such growth? It could be that the company’s revenue has dramatically increased in recent years, and thus people want to invest now in the hopes of significant profits in the future. It may be that the company has become significantly more profitable, either via growing revenue, shrinking costs, or both. It could also be that the company was significantly undervalued in the past, and now the stock price is finally realizing the company’s intrinsic value.
In the case of GameStop, we don’t think that any of these explanations fit. From fiscal years (FY) 2015-2019, GameStop’s net revenue has decreased by roughly 28%.[1] GameStop went from a $379.2 million net profit from continuing operations in FY 2015 to $(464.4) million in net losses from continuing operations in FY 2019.[1] Additionally, GameStop has less total assets, as well as similar liabilities, in FY 2019 relative to FY 2015.[1] Preliminary financial data from GameStop suggests these trends are continuing for FY 2020.[2]

Source: GameStop 2019 Annual Report, Page 22.
If growing revenue, growing profits, or undervaluation cannot adequately explain GameStop’s dramatic valuation growth, what else can explain it?
We think the explanation is short-term price speculation. Price speculation is not new: it has happened many times in the past, and it has many names. For example, in 1936, John Maynard Keynes defined The Castle-In-The-Air Theory.[3] In the book A Random Walk Down Wall Street, Burton Malkiel explains The Castle-In-The-Air Theory as follows:[4]

This price speculation strategy has worked for GameStop stock over the past few years.[5] Famous investors such as Michael Burry (of “The Big Short“ fame) made significant investments into GameStop, while smaller individual investors have collaborated via Reddit and Robinhood to drive up the price.[6] Contrarily, some investors have decided to short the stock (profiting when the stock declines), and have declared their actions quite publicly.[7] Particularly for smaller stocks, in our anecdotal experience, when strong vocal investors publicly argue with strong vocal short sellers, short-term stock price volatility often follows. So far, this volatility has benefitted GameStop investors.
This recent GameStop situation shows the upside of price speculation. However, we do not believe that price speculation works for the vast majority of investors over the long-term. For example, as of 31-Dec-2019, DALBAR found that the average equity mutual fund investor underperformed the S&P 500 (a benchmark for the US stock market) by nearly 5% annually over a 30-year span.[8] For a $100,000 initial investment, that’s a 30-year ending portfolio balance of $437,161 for the average equity mutual fund investor compared to $1,726,004 for the S&P 500.[8] DALBAR argues that price speculation partially contributes to the average investor equity fund investor underperformance relative to the S&P 500.[9]
Other studies have also found significant underperformance for the average investor who invests in individual stocks as well as who engages in short-term price speculation.[10][11] If most investors underperform broad market indices by so much, why do these investors continue to price speculate? We think it’s a combination of psychology - such as not wanting to miss out on big opportunities, wanting to follow others, and not wanting to regret decisions (further defined below) - combined with significant investment costs such as transaction fees (including bid-ask spreads), expense ratios, and unnecessary taxes.
We think that investing well over the long-term is tough, but we think price speculating over the long-term is even harder. As hard as it is to watch stocks such as GameStop go up, we think the evidence is clear: investing in low-cost, tax-efficient, broadly-diversified mutual funds and ETFS will help our clients outperform the vast majority of investors over the long-term.
Important Disclosure Information and Sources:
[1] “GameStop Corp. - 2019 Annual Report“. GameStop, 2020, news.gamestop.com.
[2] “GameStop Corp. - Form 10Q”. GameStop, December 2020, news.gamestop.com.
[3] “The General Theory of Employment, Interest, and Money“. John Maynard Keynes, 1936.
[4] “A Random Walk Down Wall Street: The Time-tested Strategy for Successful Investing”. Burton Malkiel, 2016, W. W. Norton & Company.
[5] “GameStop Shares Fall as Some Brokers Curb Trades.“ The Wall Street Journal, 28-Jan-2021, wsj.com.
[6] “'Big Short' investor Michael Burry made a 1,500% gain on GameStop during its Reddit-fueled rally“. Theron Mohamed, 26-Jan-2021, businessinsider.com.
[7] “The GameStop Short Squeeze Shows an Ugly Side of the Investing World“. Gregory Zuckerman and Geoffrey Rogow, 28-Jan-2021, wsj.com.
[8] “2020 QAIB Report”. DALBAR, 2020, wealthwatchadvisors.com.
[9] “2019 QAIB Study“. DALBAR, 2019, cswadvisors.org.
[10] “Unconventional Success: A Fundamental Approach to Personal Investment“. David Swensen, 2005, Free Press.
[11] “Money: Master The Game“. Tony Robbins, 2016, Simon & Schuster.
There is no guarantee investment strategies will be successful. Past performance is no guarantee of future results. Diversification neither assures a profit nor guarantees against a loss in a declining market.
MarketPlus Investing® models consist of institutional quality registered investment companies. Investment values will fluctuate, and shares, when redeemed, may be worth more or less than original cost.
Advisory services are provided by SJS Investment Services, a registered investment advisor with the SEC. Registration does not imply a certain level of skill or training. SJS Investment Services does not provide legal or tax advice. Please consult your legal or tax professionals for specific advice. This material has been prepared for informational purposes only.
Indices are not available for direct investment. Their performance does not reflect the expenses associated with management of an actual portfolio.
The S&P 500 Index is a free float-adjusted market-capitalization-weighted index of 500 of the largest publicly traded companies in the United States.
Hyperlinks to third-party information are provided as a convenience and we disclaim any responsibility for information, services or products found on websites or other information linked hereto.
Suggested Reading

While You Weren't Sleeping - Performance Of Markets In 2020
Ignorance is bliss. At least that’s how we feel about the markets in 2020. The person who did not look at the news or troubles of the world was rewarded with an incredible year in the markets.
By SJS Chief Investment Officer Tom Kelly, CFA.
Ignorance is bliss. At least that’s how we feel about the markets in 2020. The person who did not look at the news or troubles of the world was rewarded with an incredible year in the markets. A good investment approach to 2020 would have been to fall asleep on January 1 and wake up on December 31, with a sleepwalk or two consisting of tax harvesting and rebalancing along the way.
Don’t get us wrong—we know that 2020 brought challenges for many, many people. But if we had told you at the beginning of the year that 2020 would bring a global pandemic that would cripple the U.S. gross domestic product (GDP) by 31% in the second quarter, cause 20 million lost jobs in April, and lead to a contested presidential election in November, chances are you would have sold all your stock.[1][2][3] You and us both!
![Source: Dimensional Fund Advisors. See Important Disclosure Information [4] for index information.](https://images.squarespace-cdn.com/content/v1/5ee8ee8eb4fb337e3b806c1e/1610997932869-OYI16YSTUDTC7TE3P5IF/2021.01.22+2020+Global+Asset+Class+Returns.JPG)
Source: Dimensional Fund Advisors. See Important Disclosure Information [4] for index information.
But that is indeed what happened, and it sure would have been foolish to be wise. In 2020, the broad U.S. stock market went up over 20% and international markets went up over 7%; even bonds had strong positive returns. About the only thing that didn’t go up is real estate, which went down 9% for the year, but ended strong with a 12% return in the fourth quarter. The benefits of a well-diversified portfolio were realized as well, with large caps and small caps trading punches as the months rolled on but sharing similar total year results.[4]
While 2020 was nowhere near perfect, we hope it allowed you to grow closer to loved ones, appreciate the little conveniences a little more, and become a bit more resilient with whatever comes your way. Who knows what’s in store for 2021? Whatever it brings, leave the worrying to us, knowing that your MarketPlus Portfolio is battle tested, incorporating academic advances in portfolio design with our 25-plus years of real-world investment experience to help you achieve your specific financial goals.
Important Disclosure Information and Sources:
[1] “Gross Domestic Product.” U.S. Bureau of Economic Analysis, bea.gov.
[2] “Payroll employment down 20.5 million in April 2020.” U.S. Bureau of Labor Statistics, 12-May-2020, bls.gov.
[3] “Electoral College makes it official: Biden won, Trump lost.” Mark Sherman, 14-Dec-2020, apnews.com.
[4] Source: Dimensional Fund Advisors, Morningstar. Market segment (index representation) as follows: US Stock Market (Russell 3000 Index), International Developed Stocks (MSCI World ex USA Index [net div.]), Emerging Markets (MSCI Emerging Markets Index [net div.]), Global Real Estate (S&P Global REIT Index [net div.]), US Bond Market (Bloomberg Barclays US Aggregate Bond Index), and Global Bond Market ex US (Bloomberg Barclays Global Aggregate ex-USD Bond Index [hedged to USD]).
There is no guarantee investment strategies will be successful. Past performance is no guarantee of future results. Indices are not available for direct investment. Their performance does not reflect the expenses associated with management of an actual portfolio. In US dollars. The index performance figures assume the reinvestment of all income, including dividends and capital gains.
Hyperlinks to third-party information are provided as a convenience and we disclaim any responsibility for information, services or products found on websites or other information linked hereto.
Suggested Reading

Are You Starting To Invest? Some Considerations
We think having the next generation beginning to invest is a great thing. We believe these points can help you as you start your investment journey.
By SJS Associate Advisor Michael Savage.
During the COVID-19 pandemic, there has been a mass movement by younger people to establish investment accounts.[1] They see the potential value of taking extra cash from work, economic stimulus checks, etc., and putting it to work in investments.[1] Online investment services like our own MarketPlus Online offering, Acorns, Betterment, Wealthfront, Robinhood, and others are allowing younger generations to easily establish investment accounts. For example, online brokers such as Charles Schwab, TD Ameritrade, and eTrade have seen major increases in new account openings in 2020, with some online brokers experiencing year-over-year new account growth of more than 100%.[1] Many if not most of these new accounts have been opened by millennials (ages 24-39 in 2020).[1][2]
We think having the next generation beginning to invest is a great thing. They (We) will develop years of experience and knowledge on the markets. We previously wrote about strategies to help create solid investment plans for young professionals, emphasizing the following:

Building off of the above, investors have experienced a lot over the past year. 2020 has been one of the most volatile years - in particular, March was the most volatile month - in U.S. stock market history.[3] Many growth stocks have experienced a lot of volatility, and yet have grown significantly over the past year.[4] Other stocks have not experienced similar success.[4] Particularly over the short-term, so much can happen in the stock market that doesn’t necessarily align with what is happening in the economy and society at large, as partially evidenced by how global stock markets have provided positive returns in 2020 despite the COVID-19 pandemic and associated shutdowns.[5] We think investors can learn a lot from uncertain and volatile times, and we believe the below points can help you on your investment journey.
![Sources: Statista, U.S. FBI Internet Crime Complaint Center. See Important Disclosure Information for additional details.[4]](https://images.squarespace-cdn.com/content/v1/5ee8ee8eb4fb337e3b806c1e/1609182572909-N6UBJ0ISN3EN0KXY735C/2020.12.29+Starting+To+Invest+-+Some+Considerations.png)
Invest For The Long-Term
Albert Einstein once said, “Compound interest is the eighth wonder of the world. He who understands it, earns it…. He who doesn’t, pays it.“[6] We believe that the longer you invest in a well-designed portfolio, the more you can increase your chances of positive expected returns and higher portfolio values.
For example, Warren Buffett, the famous 90-year-old investor with an estimated net worth around $85 billion in 2020 (even after donating $37 billion to charities since 2006), has repeatedly said, “If you aren't willing to own a stock for ten years, don't even think about owning it for ten minutes.“[7]
Beware of Taxes and Dividends
Dividends may seem like the best thing about investing. Lets say you have a stock worth $10 and you receive a dividend of $1. At first glance you may think “Hey, I just got a free dollar!”.
The truth to the matter is you didn’t. If a company pays $5 million in dividends, then the enterprise value (market value of equity + market value of debt) of that company would decrease by $5 million dollars. The stock value declines, in your case, by $1 to create an equal transaction. So, theoretically you still have a stock worth $10.
But we aren't done yet. Within taxable accounts, that $1 dividend will then be taxed. If your dividend income is taxed around 20%, that leaves you with $0.80. So in reality your $10 just turned in $9.80.
Additionally, if you sell a stock for a capital gain, you may end up paying taxes on the gain. You also pay more taxes if you held the stock for < 1 year.
While selling a stock for a gain may make sense under various circumstances, and while dividends can help prevent companies from spending too much money, young investors should be careful with taxes and dividends within taxable accounts.
Contribute to and Invest via a Traditional IRA and / or Roth IRA
To decrease the amount of taxes you pay, contributing to and investing via a Traditional IRA and / or Roth IRA can help you set yourself up for long-term success in the future.
Depending on your current income, when you contribute part of your income (up to $6,000) to a Traditional IRA, you don’t pay taxes on the contributions and growth until you begin withdrawing some time after turning 59 1/2. When you contribute part of your income to a Roth IRA (up to $6,000), you pay taxes now on the contribution, but do not pay taxes on the contributions and earnings as long as you wait until 59 1/2 to withdraw. This website from the U.S. IRS summarizes important information about IRAs.
Beware of Margin Trading
Margin means borrowing money, often to invest. Margin trading can amplify your gains, but it also amplifies your losses, particularly during volatile market periods like March 2020.[3] Additionally, investors usually have to pay interest on the margin, thus decreasing investment returns. Margin usually ends up hurting investors when they are not cautious using it. Just be aware that you are paying interest on the cash you borrow, and stay on top of it.
“Free Trades” Are Great, But Don’t Get Carried Away
Many investing platforms offer “free trades“, meaning that investors don’t have to pay a commission per trade. However, there are still less obvious costs to any stock trade, including bid-ask spreads, moving market prices, wash sales, capital gains taxes, etc. On its own, paying no commissions means lower costs for investors. However, since they no longer pay commissions, many investors are trading more and more, thus paying more of the less obvious costs. Additionally, increased trading can decrease the habit of investing for the long-term. Therefore, we advise people to not get carried away by “free trades.”
Summary
Starting to invest can be really valuable at a younger age. Your portfolio can grow or decline over time, and you will learn more and more as you keep investing and keep up with what is happening in the markets. We want you to be aware of what you are paying to enter the markets, do your due diligence on any investment service before opening an account, and remember that nothing is free or guaranteed.
If you would like to discuss how to better design and implement your investment portfolio, please reach out to us. We are always happy to listen and assist.
Important Disclosure Information And Sources:
[1] “Young investors pile into stocks, seeing ‘generational-buying moment’ instead of risk.“ Maggie Fitzgerald, 12-May-2020, cnbc.com.
[2] “Robinhood’s Addictive App Made Trading a Pandemic Pastime.“ Annie Massa & Sarah Ponczek, 22-Oct-2020, bloomberg.com.
[3] “The Craziest Month in Stock Market History.“ Nick Maggiulli, 01-Apr-2020, ofdollarsanddata.com.
[4] “Growth versus value: Will the tides change?“ Vanguard, 02-Sep-2020, vanguard.com.
[5] “Performance Derby: Global Markets.“ Ed Yardeni & Joe Abbott, 25-Dec-2020, yardeni.com.
[6] “Albert Einstein - Compound interest.“ Quotesonfinance.com.
[7] “How Warren Buffett’s winning investing strategy can be applied to any purchase you make.“ Emmie Martin, 04-May-2018, cnbc.com.
There is no guarantee investment strategies will be successful. Past performance is no guarantee of future results. Diversification neither assures a profit nor guarantees against a loss in a declining market.
Advisory services are provided by SJS Investment Services, a registered investment advisor with the SEC. Registration does not imply a certain level of skill or training. SJS Investment Services does not provide legal or tax advice. Please consult your legal or tax professionals for specific advice. This material has been prepared for informational purposes only.
Hyperlinks to third-party information are provided as a convenience and we disclaim any responsibility for information, services or products found on websites or other information linked hereto.
Suggested Reading

How Will Inflation Impact Your Portfolio?
Since expected U.S. inflation is now near the long-term target of 2.00%, we think it is reasonable to expect that interest rates will remain near current levels.
History and Signaling Suggest Both Inflation and Interest Rates Will Remain Low
By SJS Investment Associate Bobby Adusumilli.
The Federal Reserve of the United States of America (the Fed) has a dual mandate: to maximize employment and to stabilize prices for goods and services. To pursue this mandate, the Fed believes that a 2.00% increase in annual inflation is most appropriate in the long run.[1]
While the Fed cannot completely control inflation, the Fed influences inflation by setting a target Federal Funds Rate (the rate at which banks borrow money from the government) and more directly changing the amount of money circulating in the economy in order to push the current Federal Funds Rate to the desired rate.[1] Consequently, while the Fed doesn’t directly control most other interest rates, shorter-term interest rates (< 1 year) generally follow changes in the Federal Funds Rate, and longer-term interest rates (>= 10 years) tend to follow as well (though with more variability).[2]
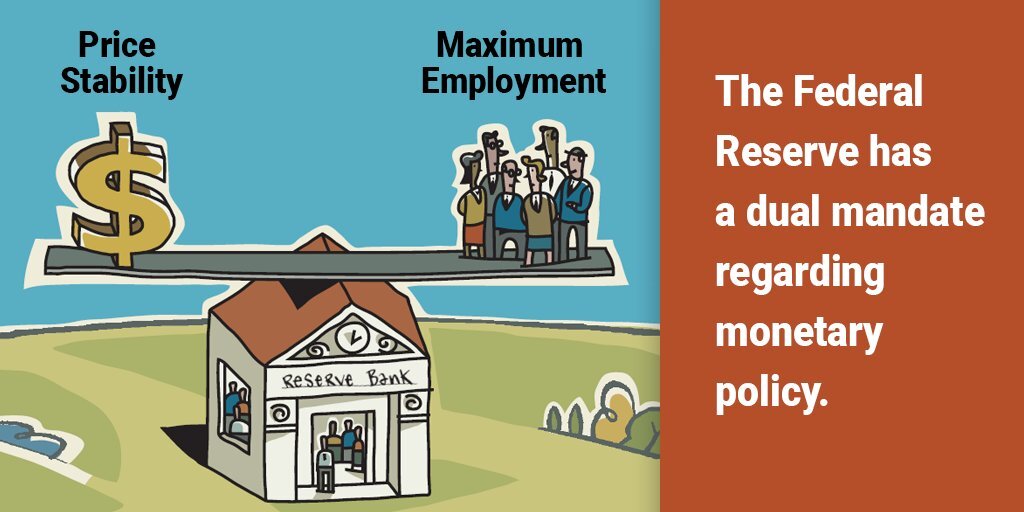
Source: “A Look at the Fed’s Dual Mandate.” Federal Reserve Bank of St. Louis, 08-Aug-2018, stlouisfed.org.
When inflation is higher (lower) than the Fed targets, the Fed will typically aim to decrease (increase) the money supply in the economy, which consequently typically increases (decreases) both the Fed Funds Rate and other interest rates, with the goal for individuals to spend less (more) and save more (less).[1]
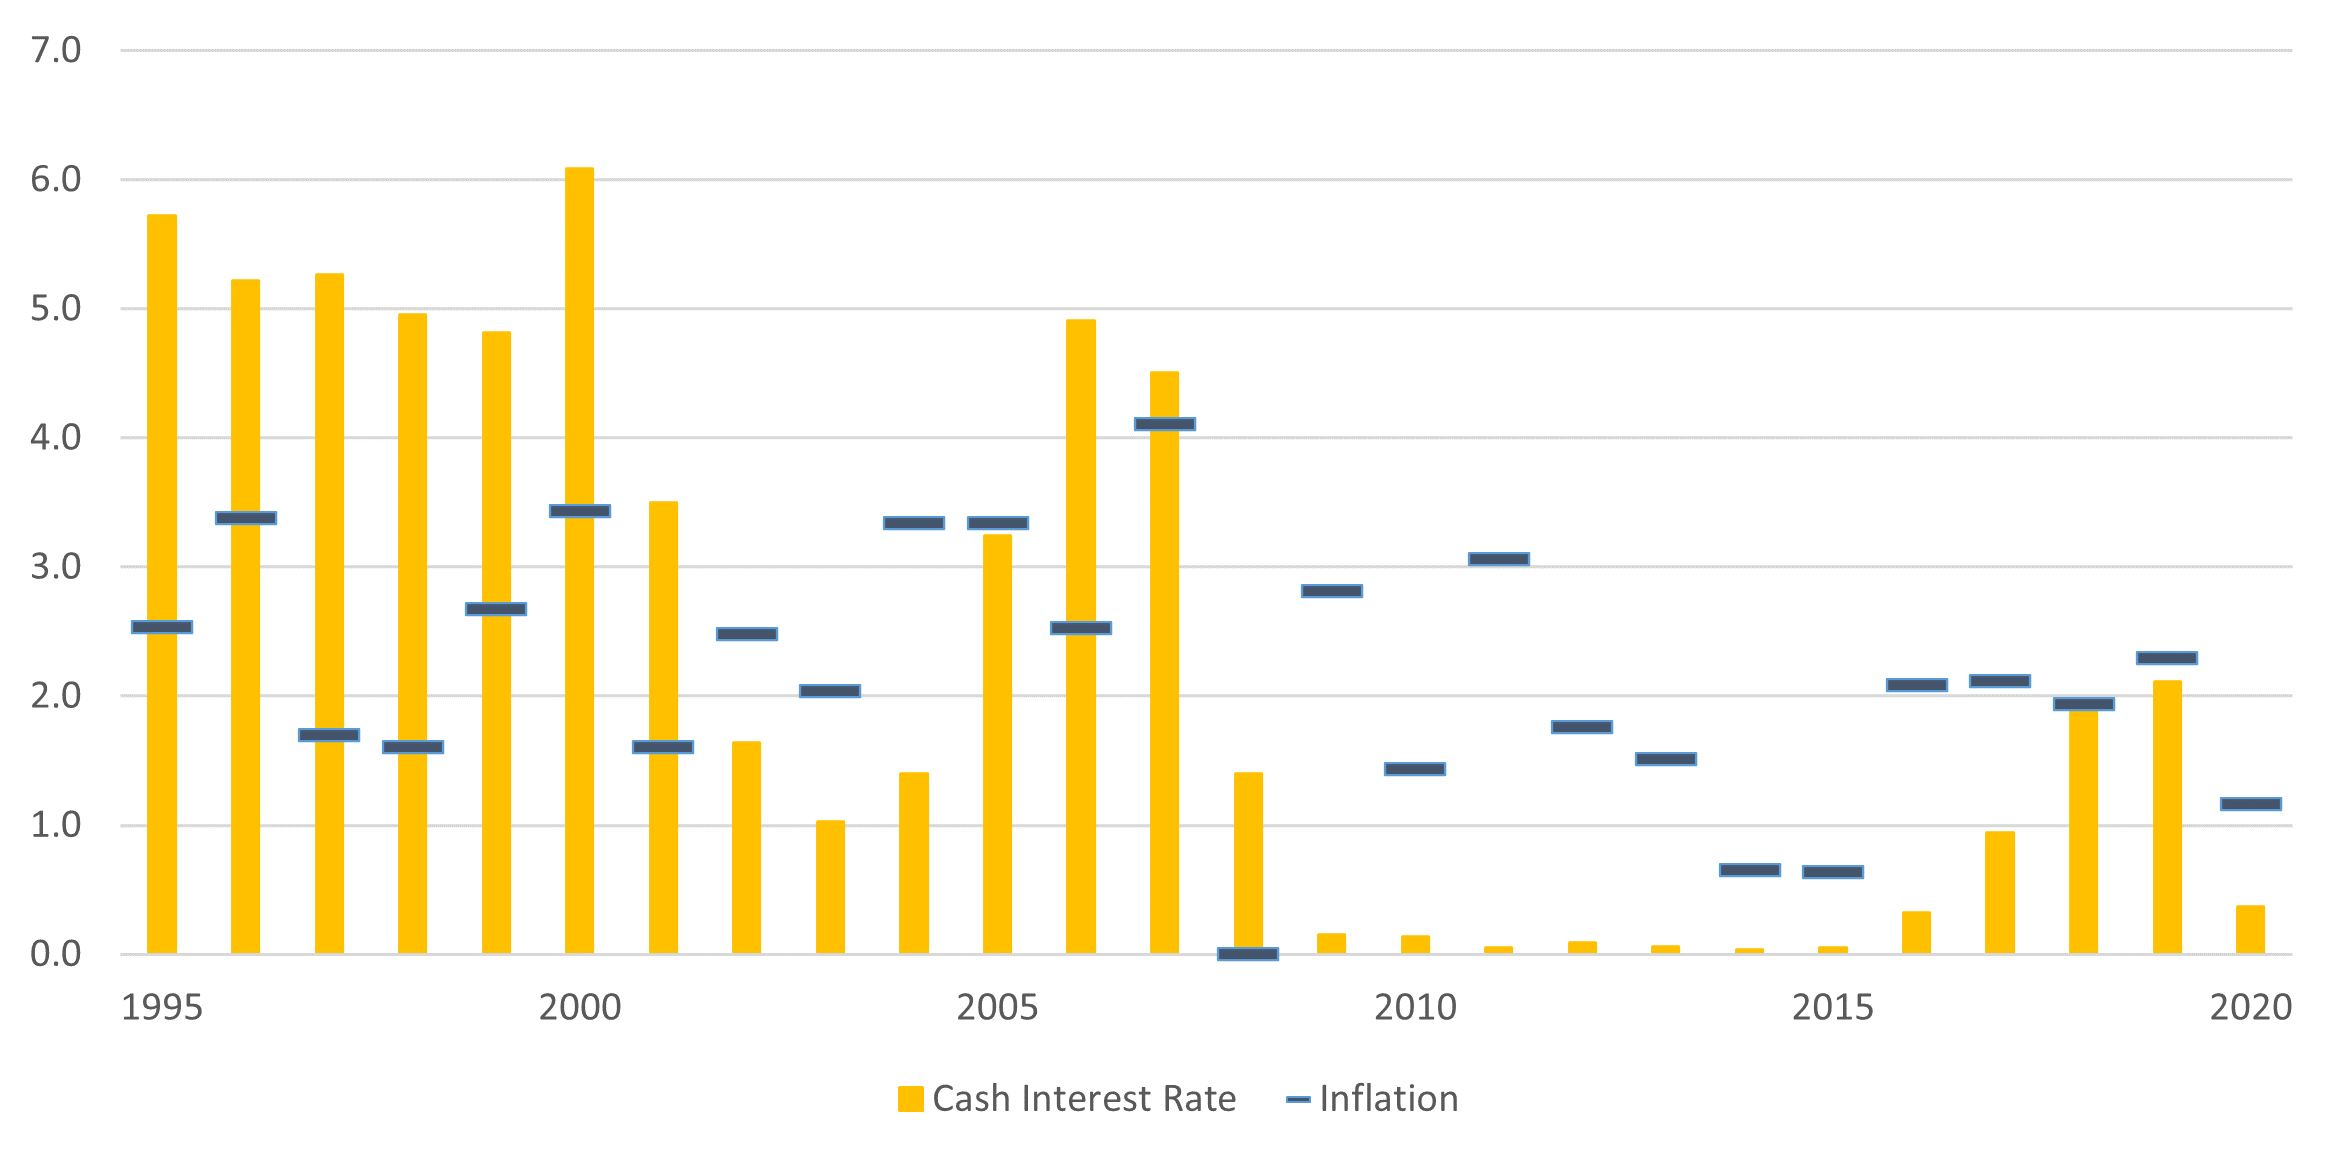
As of September 30, 2020, the Fed projects inflation to average 1.79% over the next five years, close to the long-run target of 2.00%.[1][3] As illustrated in the graph below, the Fed has worked over the past 50+ years to influence (primarily to decrease) inflation to that 2.00% goal, significantly through affecting interest rates.
Sources: Morningstar, FRED, as of 30-Sep-2020. Interest Rates: 3-Month Treasury Bill: Secondary Market Rate (TB3MS); Inflation: Consumer Price Index for All Urban Consumers: All Items in U.S. City Average (CPIAUCSL).
Generally (all else equal), as interest rates decrease, prices of existing bonds increase, partially because of increased investor demand for higher-yielding investments. Much of the strong returns for US bonds over the past 40 years is due to positive price changes caused by generally declining interest rates.[4]
However, since expected inflation is now near the long-term target, we think it is reasonable to expect that interest payments, not price changes, will drive the majority of positive bond returns over the next 10+ years, and that interest rates will remain near current levels. This provides significant justification for why SJS projects a 2.50 – 3.50% return for US aggregate bonds over the next 10+ years (as further detailed in the SJS 2020 Capital Market Expectations). Using these return expectations as part of the MarketPlus Investing approach allows SJS to help clients develop portfolios designed to meet their current and future needs.
If you would like to talk about how inflation and interest rates may impact your lifestyle and investment portfolio, please reach out to us. We are always here to listen and assist.
Important Disclosure Information and Sources
[1] “How does the Federal Reserve affect inflation and employment?“ The Federal Reserve, federalreserve.gov.
[2] “Monetary Policy Actions and Long-Term Interest Rates.“ V. Vance Roley and Gordon H. Sellon, Jr., Q4 1995, kansascityfed.org.
[3] “5-Year Forward Inflation Expectation Rate.“ Federal Reserve Bank of St. Louis, 30-Sep-2020, fred.stlouisfed.org.
[4] “An Appreciation for the Bull Market in Long-Term Bonds.“ Ben Carlson, 16-Aug-2019, awealthofcommonsense.com.
There is no guarantee investment strategies will be successful. Past performance is no guarantee of future results. Diversification neither assures a profit nor guarantees against a loss in a declining market.
Statements contained in this report that are not statements of historical fact are intended to be and are forward looking statements. Forward looking statements include expressed expectations of future events and the assumptions on which the expressed expectations are based. All forward looking statements are inherently uncertain as they are based on various expectations and assumptions concerning future events and they are subject to numerous known and unknown risks and uncertainties which could cause actual events or results to differ materially from those projected.
Hyperlinks to third-party information are provided as a convenience and we disclaim any responsibility for information, services or products found on websites or other information linked hereto.
Suggested Reading

How Will The Presidential Election Impact Your Investments?
Based on our research, we believe your portfolio allocation and the discipline to stick to it are far more important to your results than who is President.
By SJS Senior Client Portfolio Manager Tom Kelly, CFA.
We at SJS are constantly discussing the markets – how they’ve been doing, where they’re going, what we’re doing about it. Recently, the conversations have surrounded the upcoming election and our views on how one particular outcome might affect the markets. While it makes for lively discussion, what is more interesting is looking at the actual returns of the S&P 500 during election years and subsequent years that follow.

Source: S&P 500 data. In US dollars. See Important Disclosure Information.
Based on our research such as the graph above, there are no noticeable or statistical patterns on the given year or outcome. It doesn’t seem to matter if the results are expected or unexpected, or whether an elephant or donkey inhabits 1600 Pennsylvania Avenue. On average, stock market returns (as measured by the S&P 500) have been positive both in election years and the year following (and every year for that matter!). What about predicting a subsequent year based on the election year results? Don’t count on that either. The correlation between those two is -0.32 (values at or close to zero imply weak or no relationship), based on the same S&P 500 data used for the graph above.
We dug even further into the data to see if there was discernible trepidation in the 6 months leading up to new presidents, or the November-December months that coincide with election years, as shown in the graph below. Surprisingly, the annualized average return in July-December during election years was 18.6%, compared to 10.6% during non-election years. The months of November and December were great times to be invested in the markets regardless of an election, with the annualized average return for those two months being 19.4% during election years vs. 19.8% during non-election years. We believe your portfolio allocation and the discipline to stick to it are far more important to your investment results than who sits in the White House.

Source: S&P 500 data. In US dollars. See Important Disclosure Information.
The big takeaways from our research are consistent with the MarketPlus Investing’s core fundamentals, primarily that speculating is futile and the stock market rewards investors over the long term. Regardless of the presidential party, policy changes, and the unknown events, we recommend sticking with your MarketPlus designed portfolio to help you reach your goals.
If you have any questions on how the upcoming election may impact your portfolio, please reach out to us. We are always here to listen and assist.

Source: Dimensional Fund Advisors. In US dollars. Growth of wealth shows the growth of a hypothetical investment of $100 in the securities in the Fama / French US Total Market Research Index. See Important Disclosure Information.
Important Disclosure Information and Sources
There is no guarantee investment strategies will be successful. Past performance is no guarantee of future results. Diversification neither assures a profit nor guarantees against a loss in a declining market.
Hyperlinks to third-party information are provided as a convenience and we disclaim any responsibility for information, services or products found on websites or other information linked hereto.
Indices are not available for direct investment. Their performance does not reflect the expenses associated with management of an actual portfolio. In US dollars. The index performance figures assume the reinvestment of all income, including dividends and capital gains. The performance of the indices was obtained from published sources believed to be reliable but which are not warranted as to accuracy or completeness.
The S&P 500 Index is a free float-adjusted market-capitalization-weighted index of 500 of the largest publicly traded companies in the United States. Source: S&P data © 2020 S&P Dow Jones Indices LLC, a division of S&P Global. All rights reserved.
The growth of wealth chart begins with the start of the first full presidential term (March 4, 1929) for which Fama / French Total US Market Research Index data is available and ends on June 30, 2020. Data presented in the growth of wealth chart is hypothetical and assumes reinvestment of income and no transaction costs or taxes. The chart is for illustrative purposes only and is not indicative of any investment.
The Fama / French Total US Market Research Index is a value-weighed US market index is constructed every month, using all issues listed on the NYSE, AMEX, or Nasdaq with available outstanding shares and valid prices for that month and the month before. Exclusions: American depositary receipts. Sources: CRSP for value-weighted US market return. Rebalancing: Monthly. Dividends: Reinvested in the paying company until the portfolio is rebalanced.
Suggested Reading

Unmasking The 2020 Stock Market
As we begin the last quarter of a surreal 2020, SJS feels compelled to “unmask” the U.S. stock market’s performance year-to-date.
By SJS Founder & CEO Scott Savage.
Irrespective of your opinion about wearing a mask, all of us can now better relate with what Batman (aka Bruce Wayne) had to deal with while fighting crime in Gotham City. As we begin the last quarter of a surreal 2020, SJS feels compelled to “unmask” the U.S. stock market’s performance year-to-date, shining a light on how the returns of just five stocks are obscuring how, in our opinion, the average U.S. publicly traded company is doing.
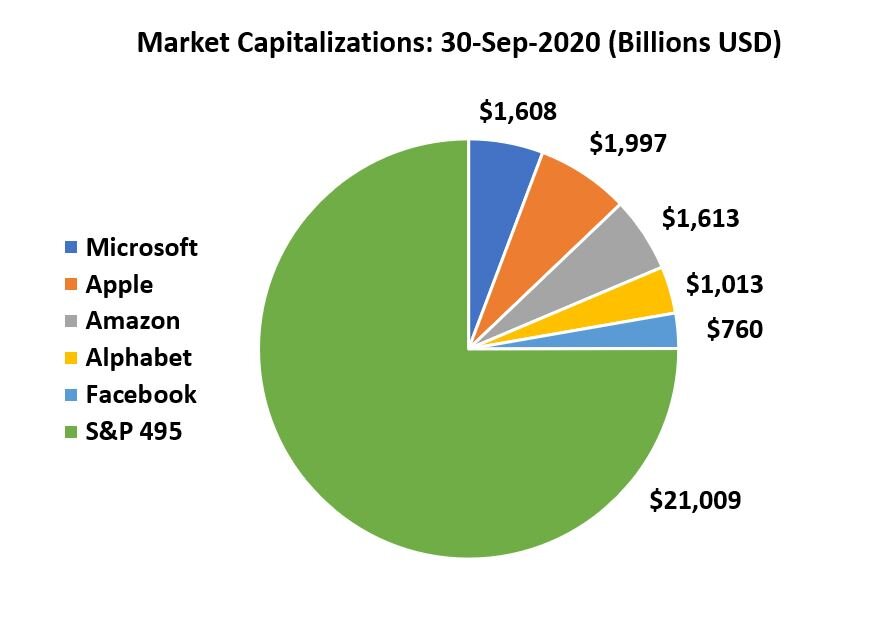
Despite unprecedented market volatility and the resulting decline fueled by panic selling in February and March, the S&P 500 Index has seemingly fully recovered. As of September 30th, the S&P 500 enjoyed a positive return of 5.6% year-to-date. During the same time, the “S&P 495”, that is, the same index with the five largest companies removed had a negative return, -7.7%! These five companies are Apple, Amazon, Microsoft, Facebook, and Alphabet (Google’s parent).
Sources: Yardeni Research and Yahoo Finance, as of 30-Sep-2020.
How did this happen? Well, the S&P 500 and many market indices are “cap-weighted” meaning, the larger the company, the more “weight” it carries in the index. In fact, these five companies made up 25% of the S&P 500 as of September 30th. And these five stocks have gained 47.5% year-to-date through the end of September. That’s right, 47.5%! This remarkable performance so far in 2020 has masked the fact that the average stock is down this year!

Sources: Yahoo Finance, as of 30-Sep-2020.
A similar phenomenon happened in the technology sector during the dot-com era of the late 1990’s. The dot-com bubble burst, and the average investor in an S&P 500 index fund earned no return during the subsequent ten-year period. Some have called this “the lost decade.” And with these five companies trading at a price earnings multiple of 35, we are happy to be more diversified in our investment strategies than these cap-weighted indices.
While we are not predicting a crash in the five companies that have led the U.S. market’s advance so far this year, diversification remains a foundational principle of MarketPlus Investing® and is instrumental in managing future risks and reaping future expected returns. Risks include those we perceive as well as those we cannot yet anticipate. Expected returns will vary across market environments, and the SJS Investment Committee reviews future capital market return expectations in decisions about investment design and asset allocation. Just another way that we work on your behalf to help you unmask the noise of the markets, and to focus on the time-tested strategies that can help you achieve your goals.
Important Disclosure Information and Sources
Past performance does not guarantee future results. Diversification does not eliminate the risk of market loss.
Hyperlinks to third-party information are provided as a convenience and we disclaim any responsibility for information, services or products found on websites or other information linked hereto.
Suggested Reading

What Business Should You Start?
I am often asked by aspiring entrepreneurs, “What business should I start?” If you can find overlap in these three areas, you just might have a business idea.
By SJS Founder & CEO Scott Savage.
As a business founder, I am often asked by aspiring entrepreneurs, “What business should I start?” If a picture is worth a thousand words, the diagram below should save you from reading too many words from me on this subject. To me, if you can find overlap in these three areas, you just might have a business idea.
Work That Energizes You
If you do what you love and energizes you, you will never work a day in your life. This is the sentiment that many business owners I work with often share. If you “feel the energy” in a certain type of work, step one is complete.
Is There A Market?
Determine if there is a market, meaning customers who value and are willing to pay for the goods or service you provide. The bigger the market, the better. A lot of competition means a big market. Don’t avoid starting a business because there is a lot of competition. Conversely, be wary of starting a business you think has no competition. In my experience, this is a red warning flag.
Can I Earn Money?
There is no shame in wanting to earn as much money as possible doing work that energizes you, and has customers who value what you are doing and who are willing to pay for it. I get up every day with the idea of letting the world know about problems we solve for clients of SJS. Solving problems for others is another way to say you are a business owner.
Good luck on your journey! I wish you the best.
Suggested Reading

I Know You Can’t Predict The Future, But….
The stock market, like the bookmaker, handicaps all known information. You are betting on if your expectation is different than what the market expects.
By SJS Senior Advisor & Director of Institutional Investment Management Kirk Ludwig.
It’s human nature to ponder what the future holds and what it means to your investments. As the market grapples to understand the long-term implications of the COVID-19 pandemic, global trade, elections or (fill in the blank), the market continually factors known information into today’s prices, whether we understand all of the underlying factors, or not.[1] With so many variables influencing future market movements, it is a challenge to predict how the markets will respond…yet, investors still try to speculate on what happens next…we can’t help it, it’s our nature!
During periods of great uncertainty, markets can change course quickly, creating high volatility while the markets reprice risk. These periods, like we are experiencing in 2020, can be very perplexing to understand. How can stocks move higher when the future seems so uncertain? Are historically low interest rates signaling slow growth and low inflation for many years to come? What does the rise in the price of gold signal to the markets? These types of questions are endless.
Think of the market like a sports gambling bookmaker. If you were to place a bet on the outcome of a professional sporting event, you’d likely research who has home team advantage, injury lists, top player stats, and all the other factors which may give one team an advantage over the other. The bookmaker, and all the other gamblers, are aware of these same advantages. In order to even the playing field, the bookmaker will create a “spread”, giving the underdog extra points to compensate for these differences. At this point, you’re no longer betting on who wins, but you’re betting on if the spread is correct or not. This is much more difficult to predict!

The stock market, like the bookmaker, is always handicapping all known information. If you’re increasing or decreasing your risk exposure to stocks based on how you believe the current news will impact your investments, know that the market has already priced in these factors. What you’re really betting on is if your expectation is different than what the entire market, on average, is expecting. Again, a much more difficult prediction.
We don’t think that an investment strategy should be built on speculating if the market is accurately reflecting future expectations. More importantly, we think investors should reflect on how their investment strategy is positioned to meet their long-term desired outcomes based on long-term patterns.
At SJS, we focus our attention on the process and design. We develop portfolios to match the risk and return expectations of our clients through broad global diversification with the proper balance of growth and stability to match their long-term goals. We believe design matters most. Having the appropriate exposures to multiple asset classes and market factors improves the likelihood of a successful investment plan and removes the temptation to speculate on current events.[2][3]
If you would like to learn more about how to design your investment portfolio, feel free to reach out to us. We are always here to listen and assist!

Important Disclosure Information and Sources:
[1] “Eugene F. Fama, efficient markets, and the Nobel Prize.” John Cochrane, 20-May-2014, Chicago Booth Review.
[2] Unconventional Success: A Fundamental Approach to Personal Investment. David Swensen, 2005, Free Press.
[3] MarketPlus Investing® models consist of institutional quality mutual funds. Mutual fund investment values will fluctuate, and shares, when redeemed, may be worth more or less than original cost.
Advisory services are provided by SJS Investment Services, a registered investment advisor (RIA) with the SEC. Registration does not imply a certain level of skill or training. This material has been prepared for informational purposes only.
There is no guarantee investment strategies will be successful. Past performance is no guarantee of future results. Diversification neither assures a profit nor guarantees against a loss in a declining market.
Hyperlinks to third-party information are provided as a convenience and we disclaim any responsibility for information, services or products found on websites or other information linked hereto.
Suggested Reading

The Markets And Economy Are Loosely Connected
As the stock market goes, so goes the economy. However, in any given year, economic ups and downs can diverge significantly from the direction of the market.
Just like walking your dog!
By SJS Founder & CEO Scott Savage.
Why is the stock market so volatile? What is today’s big drop telling us about the economy? What about yesterday’s big jump? Is there a recession coming? Another depression? Will I miss out on a market rebound?
We are experienced enough to know that we don’t know all the answers. But history has demonstrated that over long periods of time, the stock market and the economy are linked. As the stock market goes, so goes the economy. However, in any given year, economic ups and downs can diverge significantly from the direction of the market.
A well-traveled industry metaphor may be helpful in understanding the relationship between the day to day movement of the stock market and the real economy.
Imagine a dog owner steadily walking her dog through the park. The dog is on a leash but doing what dogs do in a busy park on a leash: barking, jumping, straining on the leash. To the left, then right, and then SQUIRREL!
The dog is the stock market, the dog owner is the economy. They end their walk in the park together, but along the way they sometimes move together, sometimes in opposite directions. If you simply watch the dog for a period of time, you might not know WHAT direction they are headed!
So the next time the market goes way up, or way down, we hope the dog owner and their “best friend” analogy will help you keep the long term view. That’s the view—and destination—we had in mind when your investment portfolio was designed in the first place.
Suggested Reading

Market Movements Q2 2020: The Sequel
In our estimation and experience, most predictions are largely speculative and unreliable. The only prediction we are prepared to make is based on historical evidence that prices/economies tend to recover after economic shocks.
By SJS President Kevin Kelly, CFA.
EQUITY MARKETS
Last quarter, global markets experienced a synchronous drop in equity asset classes. Investors around the world arrived at lower market valuations that included falling revenues and newly identified risks. We can now offer a more encouraging picture as a rising trend has been evident in the same asset classes during the second calendar quarter:

Source: Morningstar.com, July 1, 2020. Equity asset classes are considered representative by SJS Investment Services based on actual results of institutional mutual funds within these categories (DFQTX, DFIEX, DFCEX, and DFGEX). Actual performance for each client may be different. Past performance is no guarantee of future returns.
As of June 30, 2020, the quarterly gain in major equity asset classes spanned a positive range of 12 to 22%.
THOSE DOGGONE PREDICTIONS!
It is worth re-stating that in our estimation and experience, most predictions are largely speculative and unreliable. The only prediction we are prepared to make is based on historical evidence that prices/economies tend to recover after economic shocks.
But we acknowledge that things can get worse from here and the current upward trend is in no way guaranteed to continue. Predicting where the dog at the end of the leash will go is range-bound at best…and even then, the dog can sometimes break his leash!
Investments, by their nature, are unpredictable. Yet we continually strive to manage your investments so that you can have the confidence that your MarketPlus® portfolio has been trained at obedience school!
If you ever find the investment markets make you “uncomfortable,“ let us do the worrying for you, so you can focus on the people and causes that matter most to you. We are always here for you, to lend an ear, to listen, and assist!
Important Disclosure Information:
Past performance is no guarantee of future results. There is no guarantee investment strategies will be successful. Diversification neither assures a profit nor guarantees against a loss in a declining market. MarketPlus Investing® models consist of institutional quality mutual funds. Mutual fund investment values will fluctuate, and shares, when redeemed, may be worth more or less than original cost.
Indices are not available for direct investment. Their performance does not reflect the expenses associated with management of an actual portfolio. The performance of the indices was obtained from published sources believed to be reliable but which are not warranted as to accuracy or completeness.
Hyperlinks to third-party information are provided as a convenience and we disclaim any responsibility for information, services or products found on websites or other information linked hereto.
Suggested Reading

Value Opportunities
When you “buy low,” and prices go lower, it can test conviction. Nonetheless, we believe now is a good time to stick with and lean-in to MarketPlus Investing.
By SJS President Kevin Kelly, CFA.
Investor Howard Marks recently wrote, “All great investments begin in discomfort… ‘When the time comes to buy, you won’t want to.’ It’s not easy to buy when the news is terrible, prices are collapsing and it’s impossible to have an idea where the bottom lies. But doing so should be the investor’s greatest aspiration.”[1]
In an effort to buy low and sell high, many investors attempt market timing. However, studies have repeatedly shown that most investors who attempt to time the market significantly underperform broad market indices, due to many factors.[2] So if market timing is not reliable, what else can investors do to achieve higher expected returns?
MarketPlus Investing focuses on broad global diversification across thousands of securities via mutual funds. At the same time, we systematically seek stock attributes that have demonstrated higher expected returns over time.[3] Relative to broad market stock indices, MarketPlus Investing invests in mutual funds that tend to overweight stocks with financial qualities that, relative to their trading prices, have provided premium returns historically.[3,4]
Some of these qualities point us to smaller company stocks.[3] Other financial attributes suggest a bias towards “value stocks”, a quality that famed investor Warren Buffett tends to favor.[3,5]
In the spirit of Howard Marks, recent returns of small value stocks have provided plenty of discomfort, especially compared to the “blue chip“ index as represented by the S&P 500.

Sources: Ken French Data Library, Dimensional Fund Advisors Returns Web. As of 30-Apr-2020. See Important Disclosure Information for additional details.
But other than “discomfort,” are there any measurable indications that small value stocks may be a good place to invest? Perhaps one indication is that the valuation differences between US growth stocks and value stocks are at or near their greatest dispersions in history.[6] In particular, US growth stocks (particularly large growth stocks) are currently trading near valuations not seen since the 2000 Dot Com Bubble.[7] Contrarily, value stocks (particularly small value stocks) are below 40-year valuation averages, as demonstrated below.[8]

Sources: Dimensional Fund Advisors, CRSP, and Compustat. As of 31-Mar-2020. See Important Disclosure Information for additional details.
We do not believe these major valuation differences will continue over the long-term. Much of the recent outperformance of growth stocks is attributable to the performance of five of the largest stocks in the S&P 500: Microsoft (MSFT), Amazon (AMZN), Apple (AAPL), Alphabet (GOOG / GOOGL), and Facebook (FB).[9] These stocks currently make up > 20% of the S&P 500, and are all trading near all-time highs.[9] Based on forward price / earnings ratios, the stock market has already priced in high growth into these companies’ valuations.

Sources: Morningstar Direct, YCharts, Yahoo Finance. As of 29-May-2020. See Important Disclosure Information for additional details.
We think historically cheap investments are more likely to provide higher returns over time than expensive investments, and the data suggests small and value stocks are relatively quite cheap today.[10,11]
There are sometimes rare opportunities when specific parts of the market are very attractively valued relative to broad markets, which often leads to higher expected returns over time.[12] Is this such an opportunity? Only time will tell. But we believe broad diversification and a disciplined rebalancing mechanism that incorporates valuations helps investors get appropriate returns for the risk they are assuming.
When you “buy low,” and prices go lower still, it can be a test of investment conviction. Nonetheless, we believe right now is a good time to stick with and lean-in to our disciplined investment approach called MarketPlus Investing.
If you ever find the investment markets make you “uncomfortable,“ let us do the worrying for you, so you can focus on the people and causes that matter most to you. We are always here for you, to lend an ear, to listen, and assist!
Important Disclosure Information and Sources:
“Calibrating.“ Howard Marks, 06-Apr-2020, oaktreecapital.com.
Unconventional Success. David Swensen, 09-Aug-2005, Free Press.
“A Five-Factor Asset Pricing Model.“ Eugene Fama and Kenneth French, September 2014, Journal of Financial Economics.
“Dimensional Fund Advisors: A Deeper Look At The Performance.“ Mark Hebner and Murray Coleman, 04-Dec-2019, ifa.com. Please see Important Disclosure Information for additional information on MarketPlus Investing All Equity Model Portfolio.
“Berkshire Hathaway Inc. Shareholder Letters – 2020.“ Berkshire Hathaway, 2020, berkshirehathaway.com.
“Is (Systematic) Value Investing Dead?“ Cliff Asness, 08-May-2020, aqr.com.
“Lessons From the Dot-Com Bust.“ Mark Hulbert, 08-Mar-2020, Wall Street Journal.
“Spread the Word: What’s New with Valuation Ratios.“ Dimensional Fund Advisors, 14-May-2020, mydimensional.com.
“How Markets Work and the FAANG Mentality.“ Dimensional Fund Advisors, 2019, us.dimensional.com.
“Vanguard’s economic and market outlook for 2020: The new age of uncertainty.“ Vanguard Research, Dec-2019, vanguard.com.
“An Apology for Small-Cap Value.“ Verdad Capital, 04-May-2020, verdadcap.com.
“Crisis Investing: How to Maximize Returns During Market Panics.“ Daniel Rasmussen, Brian Chingono, Graham Infinger, Bryce McDonald, Greg Obenshain, and Chris Satterthwaite, 2019, verdadcap.com.
Past performance is no guarantee of future results. There is no guarantee investment strategies will be successful. Diversification neither assures a profit nor guarantees against a loss in a declining market.
Indices are not available for direct investment. Their performance does not reflect the expenses associated with management of an actual portfolio. The performance of the indices was obtained from published sources believed to be reliable but which are not warranted as to accuracy or completeness.
MarketPlus Investing® models consist of institutional quality mutual funds. Mutual fund investment values will fluctuate, and shares, when redeemed, may be worth more or less than original cost.
Hyperlinks to third-party information are provided as a convenience and we disclaim any responsibility for information, services or products found on websites or other information linked hereto.
As of 29-May-2020, the MarketPlus All Equity Model is composed of the Dimensional US Core Equity II Fund (DFQTX: 54% weight), Dimensional International Core Equity Fund (DFIEX: 27% weight), Dimensional Emerging Markets Core Equity Fund (DFCEX: 9% weight), Vanguard US Real Estate Fund (VGSLX: 5% weight), Dimensional International Real Estate Fund (DFITX: 5% weight). There are limitations inherent in model allocations. In particular, model performance may not reflect the impact that economic and market factors may have had on the advisor’s decision making if the advisor were actually managing client money. Not to be construed as investment advice.
Advisory services are provided by SJS Investment Services, Inc.., a registered investment advisor with the SEC. Registration does not imply a certain level of skill or training. SJS Investment Services does not provide tax advice. Please consult your tax professional for specific advice. This material has been prepared for informational purposes only.
Statements contained in this report that are not statements of historical fact are intended to be and are forward looking statements. Forward looking statements include expressed expectations of future events and the assumptions on which the expressed expectations are based. All forward looking statements are inherently uncertain as they are based on various expectations and assumptions concerning future events and they are subject to numerous known and unknown risks and uncertainties which could cause actual events or results to differ materially from those projected.
The S&P 500 Index is a free float-adjusted market-capitalization-weighted index of 500 of the largest publicly traded companies in the United States.
SJS Investment Services (SJS) has created hypothetical performance returns and financial information for the S&P 495 using actual historical performance and financial information of the S&P 500 and five constituent equities: Microsoft (Ticker MSFT), Apple (APPL), Amazon (AMZN), Alphabet (GOOG / GOOGL), and Facebook (FB). The S&P 495 is not an actual index created nor managed by Standard & Poor’s. The S&P 495 hypothetical historical returns do not reflect actual trading or the performance of actual accounts. Actual client results may be materially different than the hypothetical returns. All returns presented include reinvestment of dividends and other earnings.
Value (Fama/French US Value Research Index), Growth (Fama/French US Growth Research Index), Small Value (Fama/French US Small Value Research Index):
Composition: The index portfolios for July of year t to June t+1 include all NYSE, AMEX, and NASDAQ stocks for which we have market equity for December t-1 and June of t, and (positive) book-to-market equity data for fiscal year ending in t-1.
Exclusions: ADRs, Investment Companies, Tracking Stocks, non-US incorporated companies, Closed-end funds, Certificates, Shares of Beneficial Interests, and negative book values. Sources: CRSP databases for returns and market capitalization: 1926 -present Compustat and hand-collected book values: 1926- present CRSP links to Compustat and hand-collected links: 1926- present.
Breakpoints: “The size breakpoint is the market capitalization of the median NYSE firm, so the big and small categories contain the same number of eligible NYSE firms. The BtM breakpoints split the eligible NYSE firms with positive book equity into three categories: 30% of the eligible NYSE firms with positive BE are in Low (Growth), 40% are in Medium (Neutral), and 30% are in High (Value).”
Rebalancing: Annual (at the end of June) 1926-Present Fama/French and multifactor data provided by Fama/French.
Stocks are sorted on book-to-market ratio each June, where book-to-market for year t is computed using the book equity for the last fiscal year end in t-1, divided by market equity for December of t-1. Value and growth are stocks with book-to-market ratios above and below the 70th and 30th percentiles for NYSE stocks, respectively. Aggregate price-to-book value computed as the inverse of the weighted average book-to-market ratio where market equity is for the current month.
Small stocks are NYSE, AMEX, and NADSAQ stocks below the median market cap for NYSE stocks, and big stocks are above the NYSE median. Value portfolios include NYSE, AMEX, and NASDAQ stocks above the 70th percentile of the book-to-market equity ratio (B/M) for NYSE stocks. Small Value stocks are both small and value, Big Value stocks are big and value, and Market Value includes all value stocks. Market Growth includes NYSE, AMEX, and NASDAQ stocks below the 30th percentile of the book-to-market equity ratio (B/M) for NYSE stocks. Small is the portfolio of all small stocks with no value tilt. The portfolios are value-weight (VW) and are reconstructed at the end of June each year. For each return horizon, the table shows average premium (Ave), standard deviation of premiums (Std), skewness (Skew) and kurtosis (Kurt), the percent of negative premiums (Neg), and percentiles of the distribution of premiums. The Monthly row in each block summarizes the distribution of actual monthly returns. Each of the remaining rows summarizes the distribution of returns produced by 100,000 simulations of returns for a particular horizon. The simulations allow for uncertainty about expected premiums.
Suggested Reading

You're A Winner (By Design!)
Your likelihood of “picking” these individual stock winners in advance out of the pool of 500 stocks, let alone picking all of them, is virtually zero.
By SJS Founder & CEO Scott Savage
When you find yourself at your family get-together, or football watching party, and the conversation switches from football, to the kids, grandkids, and golf, to the inevitable subject of the stock market – we want you to know that SJS Investment Services has your back.
When “Cousin Eddie” starts boasting about the killing he made in his Apple or Tyson Foods stocks last year, while conveniently saying nothing about the “hit” his portfolio took on cannabis stocks, recognize you could be just as much the bragger, although you may not even realize it. How so? Well, your MarketPlus Investing® portfolio held this year’s big winners, too.(1) And not just one or two, like Eddie, but all of them. Yes, that’s right – all of them. In fact, as of November 30, 2019, you owned every one of the top 20 performing stocks in the S&P 500 Index in the institutional quality mutual funds that make up your MarketPlus equity portfolio.(2)
Interestingly, the likelihood of Eddie, you, or most people “picking” these individual stock winners in advance out of the pool of 500 stocks, let alone picking all of them, is virtually zero. Some of the 2019 S&P winners listed in the “Top 20 U.S. Equity Performers of the Year” article as of November 30 are quite surprising, such as Xerox Holdings, up 97%, and Chipotle Mexican Grill, up 88%. Others are a little obscure, like COTY, a multinational cosmetics company, which was up 76%, and Copart, Inc., a company that offers online vehicle auctions around the globe, up 86%.(2)
So how can you get in on these winners even before the stock market recognizes them? By implementing the first tenet of MarketPlus Investing: broad diversification.(3) It’s an intentional part of the design of your portfolio to hold most, if not all, of the top-performing stocks found in indexes like the S&P 500. There’s a lot of science behind our proprietary portfolio strategy that puts the “plus” in MarketPlus – and allows you to tell Cousin Eddie a thing or two.
Admittedly, MarketPlus strategies will hold losing, or even the bottom-performing, stock positions as well. But that is part of the strength of the strategy: any given “up year” in the markets is usually driven by a select number of winners. And, as shown in the graph above, the winners will outweigh the losers in an “up year” and provide relative benefit to your holdings even during a “down year.”(4) Holding the winners – even when balanced by some losers – is what we believe to be the key to successful investing for the long-term. And your MarketPlus Investing strategy will hold most of the winners, year in and year out, by design.
So, as we look ahead into 2020, we’ll keep our focus on the numbers and the science. You can have a glass of New Year’s cheer while you high-five Eddie and tell him how great it is to know your portfolio was designed to hold all of the 2019 S&P winners. And you can feel free to emphasize ALL.
Important Disclosure Information & Sources:
(1) Stock positions held indirectly through institutional class mutual funds.
(2) Financial Advisor Magazine, “Top 20 U.S. Equity Performers of the Year,” 12/11/2019, Raymond Fazzi. Securities cross-referenced with mutual fund equity holdings as held in MarketPlus Investing® strategies.
(3) Diversification does not eliminate the risk of market losses. Past performance is no guarantee of future results.
(4) Dimensional Fund Advisors, “Study of Total Market vs. Excluding Top 10% vs. Excluding Top 25%, Performance 1994-2018,” May 2019.
Suggested Reading

The Price Is Right
When comparing price relative to a standard measure, we can make an educated guess that mutual funds made up of lower-priced stocks may offer an opportunity for a greater return in the future.
By SJS Senior Client Portfolio Manager Tom Kelly, CFA
We live in the information age. We have more information at our fingertips than generations before us could have ever dreamed. It can be overwhelming to try to process all the information available – and that holds true for just about any subject, including the markets and investing.
How in the world can an individual investor hope to read, analyze, calculate, and compare all of the available information about a company and its stock?
Simple. By looking at the price.
A stock’s current price reflects the collective expectations from ALL investors about risk and return for that stock. With more than $400 billion in stock transactions across the globe each day1, the markets combine to form an efficient and effective information-processing machine.
And the information found in market prices steers our MarketPlus Investing® approach.
For your portfolio, SJS selects mutual funds that hold stocks that have more attractive prices compared to similar companies with less attractive prices. Buy low, sell high. While a simple idea, this is an important element of the MarketPlus approach.
When comparing price relative to a standard measure, we can make an educated guess that mutual funds made up of lower-priced stocks may offer an opportunity for a greater return in the future.
For instance, MarketPlus Investing selects mutual funds made up of stocks that are cheaper as opposed to more expensive. These stocks are commonly referred to as “value” as opposed to “growth.” There are many ways to measure for this, but the comparison comes down to price-per-unit – and in this case, we like lower priced stocks per the net assets, or book value, of a company, when compared to those that are higher priced for the same book value.
When holding “total shares issued” constant, MarketPlus Investing again prefers mutual funds that are made up of lower priced stocks – or small caps – compared to higher priced stocks, or large caps.
In other cases, price may be held constant, and managers may compare which stocks have higher profits per unit of price. If profitability persists, investing in mutual funds made up of more of these higher profitability stocks may lead to greater returns in the future, or so the theory goes.
Prices can be volatile, to be sure. And all of our “buy low, sell high” philosophy and management strategy may require multiple years to play out advantageously for an investor.
So risk management and diversification2 have a role to play in designing a portfolio that will stand up to short-term individual preferences and tolerances, but still strive for long-term returns that deliver the market rate-of-return – “plus”!
It’s an ongoing pursuit, and one that we carry out with enthusiasm and rigor day after day, and year after year, for you.
We believe that the scientific and data-driven engine of your investment vehicle is state-of-the-art for this information age. And with our “You Come First” package of service and accessories, it’s hard to put a price on that!
Sources:
[1] In US dollars. Source: Dimensional Fund Advisors, using data from Bloomberg LP. Includes primary and secondary exchange trading volume globally for equities. ETFs and funds are excluded. Daily averages were computed by calculating the trading volume of each stock daily as the closing price multiplied by shares traded that day. All such trading volume is summed up and divided by 252 as an approximate number of annual trading days.
[2] Diversification does not eliminate the risk of market loss.
Important Disclosure Information:
Past performance does not guarantee future results. MarketPlus Investing models consist of institutional quality mutual funds.
Suggested Reading

A Fly On The SJS Wall
A lot of what you would hear might sound technical and complex, but you also would hear something beyond all that financial talk: our genuine concern for you, your family, and your well-being.
By SJS Founder & CEO Scott Savage
Ever wish you could be a fly on the wall?
At times, for instance, such as when you take your car in for service, and leave the mechanic thinking to yourself, “Did my transmission really need that much work?”
Or, how would you like to be a fly on the wall in the locker room when your favorite basketball team loses by two points? How about when they win by two?
We all can’t help but imagine at one time or another what words are said, and what actions are taken when no one is looking, when the public eye is nowhere to be found. Intriguing, isn’t it?
Well, what if you were buzzing around and landed on the windowsill in the conference room at SJS during one of our regular Investment Committee meetings?
You would have a nice view of the great outdoors, and maybe see a deer ramble by. You’d also hear some open and honest discussions about your investments, such as:
How heavily should we weight international stocks in your portfolio?
Do we adjust bond duration longer in light of the Fed’s position on interest rate hikes?
If a change seems compelling, is this the right market condition to implement?
As a fiduciary, we are committed to this level of due diligence. In other words, we sit on the same side of the table with you, whether there is a fly on the windowsill watching, or not.
How can the work of SJS’s Investment Committee benefit you?
We look for ways to lower your cost of investing. We review the expenses of the funds we recommend to see if there may be an alternative that invests in the same way but costs less, which may help your bottom line. If we see a clear benefit to you that outweighs any potential costs of making changes to your investments, we will make adjustments to your portfolio.
We review investment offerings that might be appropriate for clients who share a specific need, such as greater tax efficiency or a preference for an investment strategy that prioritizes social responsibility. This extra effort helps us provide investment strategies that are meaningful for you, even if they may not be the best fit for all clients.
We consider whether rebalancing or tax loss harvesting may be appropriate, either to manage risk or to offset portfolio income by selling investments to realize losses.
By observing this meeting, you’d discover the massive amount of research and thoughtful evaluation that we consider when making decisions on your behalf. You might be surprised by how much work had gone into the design of your portfolio long before you ever flew into our building.
A lot of what you would hear might sound technical and complex, but as the fly on the wall, you also would hear something beyond all that financial talk. You’d hear our genuine concern for you, your family, and your well-being. And if you heard all that, we’d be glad to know you were listening.
Suggested Reading

MarketPlus Investing: Choosing Your Target
The mix of stocks and bonds in a portfolio is the factor we believe has the most impact on expected risk and return. We stand ready to review your target with you.
By SJS Managing Director Jennifer Smiljanich
In this modern, mobile society, we all face a nearly unlimited menu of choices.
As it relates to work life alone, you can choose to stay at the same company for years, change jobs often, become part of the gig economy, retire and start a second career, or even run a business from your own home. Each path comes with different risks, and rewards.
The same is true with your investment portfolio. There are always many choices to consider:
What do I invest in – stocks or bonds – or both?
What about gold or real estate?
How do I invest – via mutual funds, individual securities, or Exchange Traded Funds (ETFs)
When do I invest – should I invest all at once or invest over time?
When do I need to make any changes?
Helping you answer these questions with a clear understanding of your needs, goals, and preferences is part of the MarketPlus Investing® process. Your MarketPlus Investing portfolio is made up of institutional quality mutual funds, which may include both stocks and bonds.
We think it’s important to take time to make sure that we find the right design for your life situation, with a foundation supported by academic learning and science. We consider many factors in determining the right portfolio mix for you, including your age, income need, time until you need to start taking withdrawals, the length of time you will need that income, your current level of income, and your personal comfort with the ups and downs in the market – to name just a few.
The relative mix of stocks and bonds in a portfolio is the factor we believe has the most impact on expected risk and return. Stocks have historically outperformed bonds, although there have been periods, notably the early 2000s, when bonds have outperformed stocks.

Data Source: Dimensional Fund Advisors
What’s the difference between the two? Stocks offer ownership in a company. If you hold Apple stocks, you own a portion of Apple. In contrast, if you own an Apple bond, you are lending money to Apple, and you are entitled to repayment of interest and principal on your loan. If Apple were to go bankrupt, bondholders have a preferred place in line ahead of stockholders for a return of their investment.
The target mix of mutual funds that may include both stocks and bonds in your MarketPlus investment portfolio likely will vary over time. Typically, the mix will tilt away from stocks and toward bonds as you get older. Other life events may lead you to adjust your allocation – maybe a change in your need for funds, loss of a spouse, retirement or career move, reduced comfort with risk, or an update to your investment purpose. Market factors may also affect your desired allocation, such as the interest rate environment or market cycle changes.
We stand ready and willing to review your target with you, and to help you discern the right choice for you, wherever you are on life’s journey.
Important Disclosure Information:
There is no guarantee investment strategies will be successful. Past performance is no guarantee of future results. Diversification neither assures a profit nor guarantees against a loss in a declining market. MarketPlus Investing® models consist of institutional quality mutual funds. Mutual fund investment values will fluctuate, and shares, when redeemed, may be worth more or less than original cost.
Suggested Reading

Reap What You Sow
Investment droughts will arise. Instead of trying to predict when and where ‘rain’ may come, we recommend that you preemptively plant your assets in rich soil.
By SJS Senior Client Portfolio Manager Tom Kelly, CFA
Sometimes, things don’t happen as you might expect. The first quarter of 2019 will be remembered for bringing us the longest government shutdown in U.S. history, continued trade wars with China, lowered consumer confidence – and U.S. investment markets that were up more than 13 percent, as shown in the graph below.[1]

The year started out with a bang rivaling the fireworks displays of New Year’s Eve, as U.S. stocks posted their best January in 30 years – all of this coming on the tail of the bear market at the end of 2018.[2]
While there may have been temptation to act to protect against further losses, this more often than not leads to loss and regret. Prudent investors who stayed the course would have been rewarded for their discipline.
The first three months of 2019 have been a budding reminder that the markets efficiently price in information before we even know or hear about it. Market timing is a fool’s errand.
In fact, Nobel laureate William Sharpe – who created the Sharpe Ratio return/risk metric, which is used to help investors understand the return of an investment compared to its risk – determined that someone who tries to time the markets must be right 74 percent of the time in order to outperform a buy-and-hold approach on a risk-adjusted basis.[3],[4] The cost of being wrong gets exacerbated during periods of volatility, just as the desire to tweak and tinker increases.
Instead of market timing, MarketPlus Investing® is based in part on the idea that diversification may be a smarter way to increase expected return for a given level of risk. Adding diversification should increase the Sharpe Ratio, which helps demonstrate that excess returns above the “risk-free rate” (the return of a U.S. Treasury bill) are the result of good investment decisions instead of increased risk taking.[3]
Investment droughts will arise, so instead of trying to predict when and where the ‘rain’ might come, we recommend that you preemptively plant your assets in rich soil – a MarketPlus portfolio designed with comprehensive market coverage, calculated risk exposure, and cost-efficient implementation.
As spring approaches, the new green shoots popping up everywhere serve as a great reminder of the growth that follows the strain of a harsh winter. Just as the work is done far before you see the fruits of your labor, our science-based process of structuring and designing portfolios to help you achieve your financial goals has weathered the test of time, through seasons both good and bad.
So, go out and enjoy working in your garden, cultivating relationships, or rooting yourself in a new hobby this spring. You can be sure we’ll be following the same nurturing approach with your portfolio by maintaining the discipline of our MarketPlus Investing philosophy.
Sources:
[1] S&P 500, 2019 YTD Performance as of 3/31/2019. Morningstar.
[2] Amrith Ramkumar, “Stocks Post Best January in 30 Years.” Wall Street Journal, 2/1/2019.
[3] Marshall Hargrave, “Sharpe Ratio Definition.” Investopedia.com, 3/9/2019.
[4] William Sharpe, “Likely Gains from Market Timing.” Financial Analysts Journal, vol. 31/no. 2, 1975.
Important Disclosure Information:
Past performance is no guarantee of future results. Indices are not available for direct investment; therefore, their performance does not reflect the expenses associated with the management of an actual portfolio. Diversification does not assure a profit or protect against loss.