
The Growing U.S. Debt: What Does It Mean for Investors?
The growing U.S. national debt has become an increasingly common topic in financial headlines, and understandably so. Total federal debt (which includes debt held by the public as well as intragovernmental debt) recently surpassed $40 trillion.[1] The Congressional Budget Office (CBO) projects that federal debt by the public will reach approximately $32.1 trillion, or 101% of GDP, by the end of fiscal year 2026, and rise to 120% of GDP by 2036, which would surpass the record set during World War II.[2]
While it is natural to wonder whether the national debt is too high, we believe it is more useful for investors to ask: What does this growing debt burden mean for the economy and financial markets, and how should an investment portfolio be positioned to navigate the potential consequences?
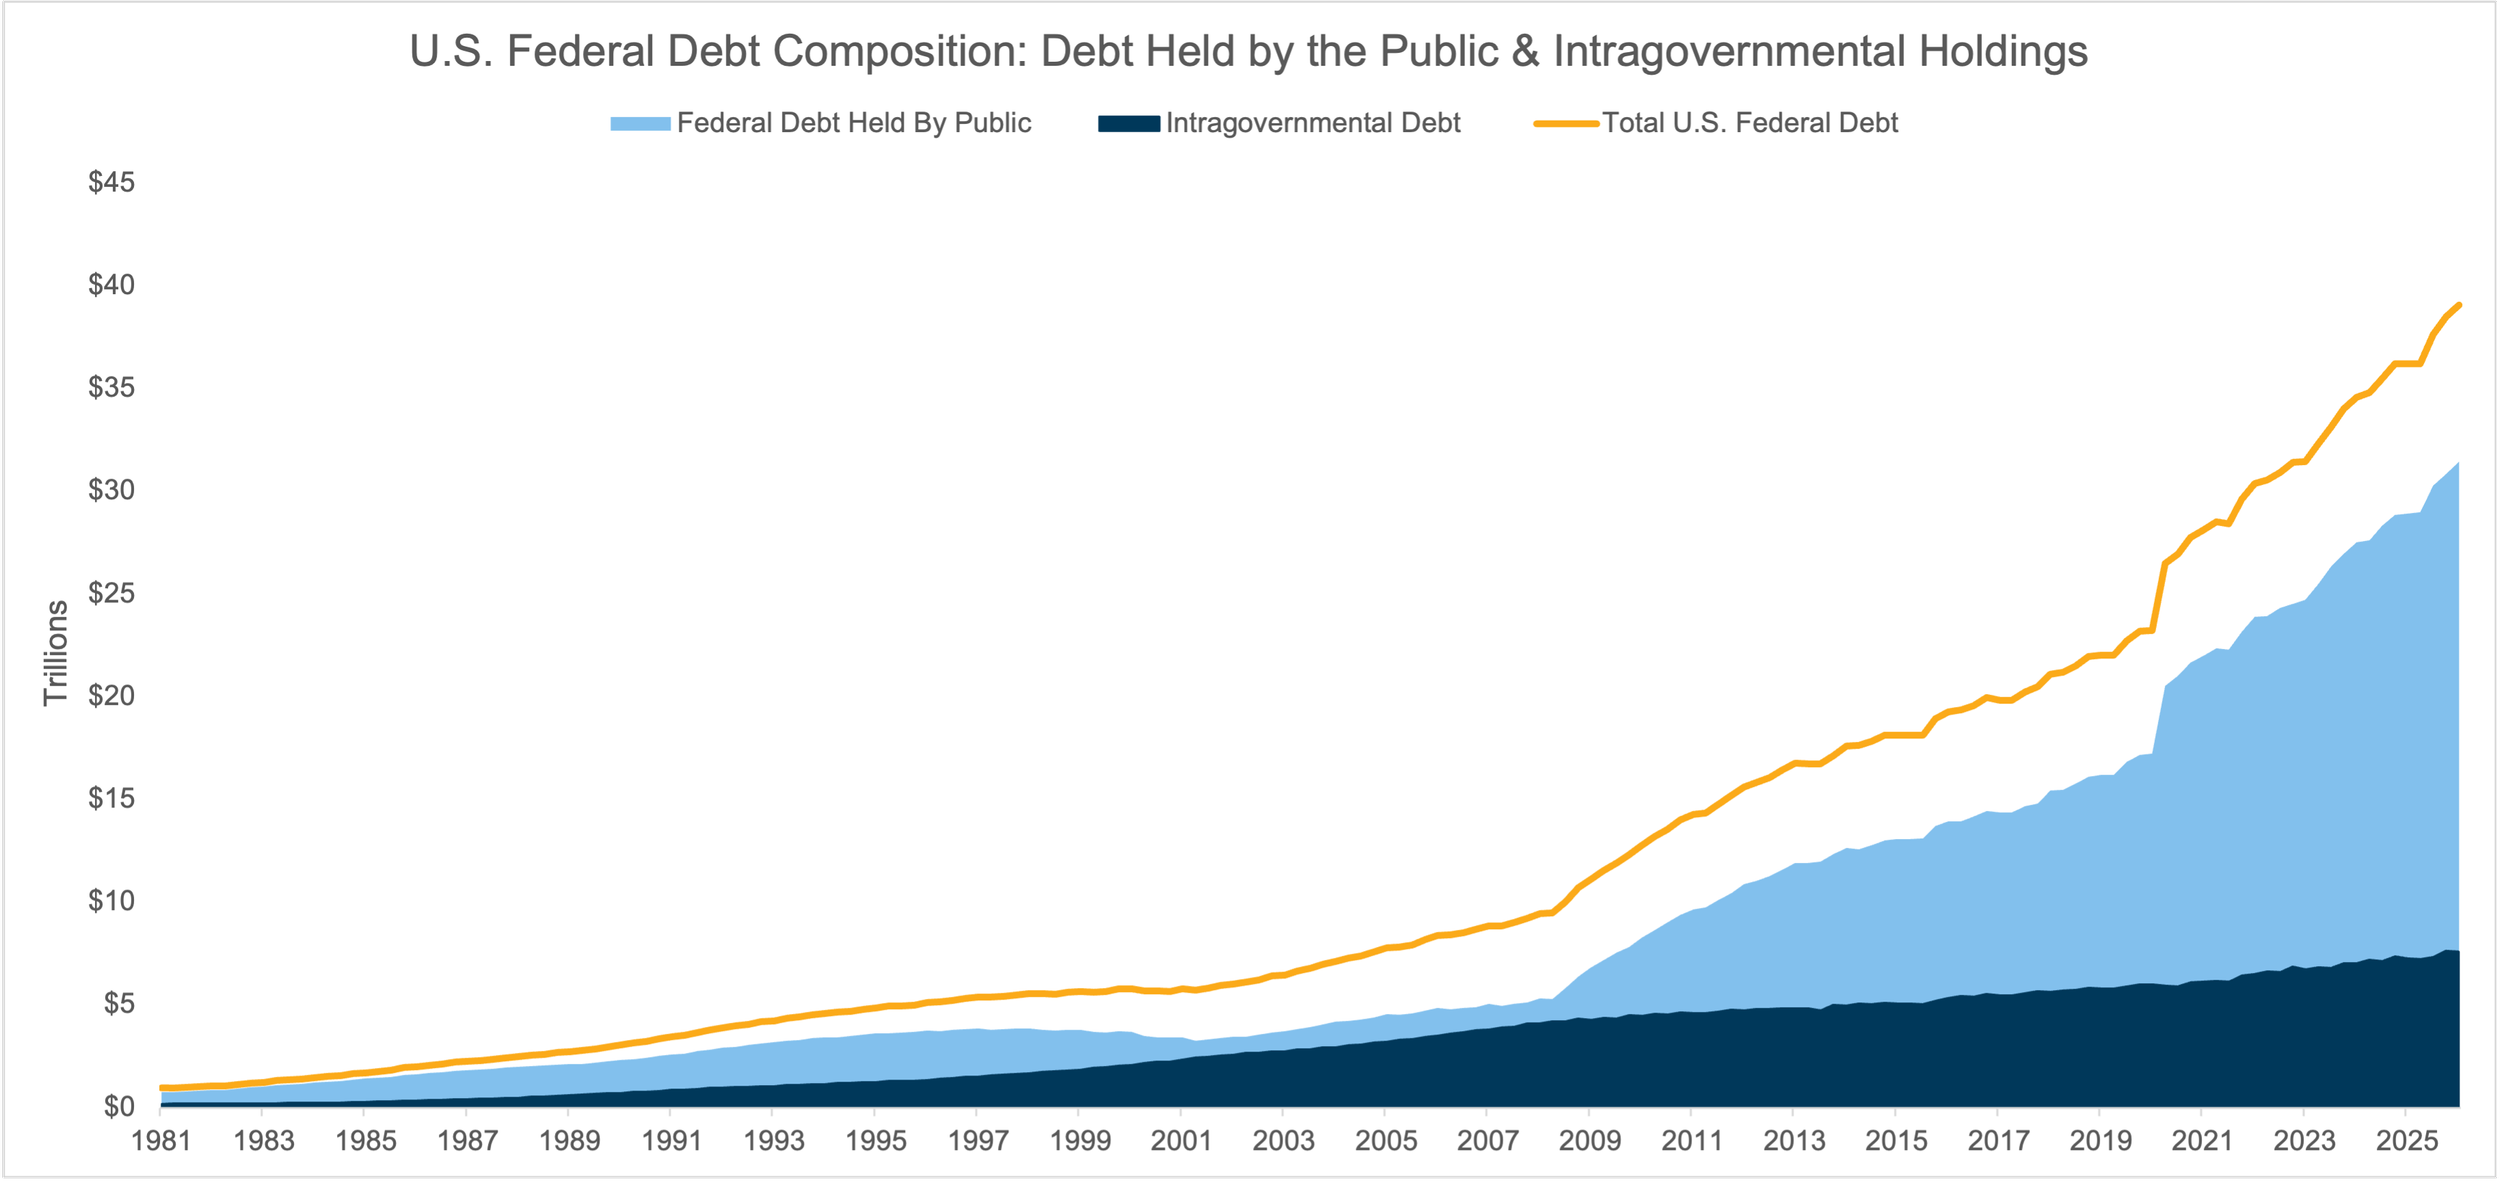
Sources: SJS Investment Services; U.S. Department of the Treasury, Fiscal Service; Federal Reserve Bank of St. Louis, FRED. Data as of August 1, 2026. U.S. federal debt is represented by total public debt (gross federal debt), comprising debt held by the public and intragovernmental holdings held by federal agencies and trusts. Data are quarterly, end-of-period, not seasonally adjusted. FRED series GFDEBTN, FYGFDPUN, and FDHBATN, retrieved October 14, 2026. See Important Disclosure Information.
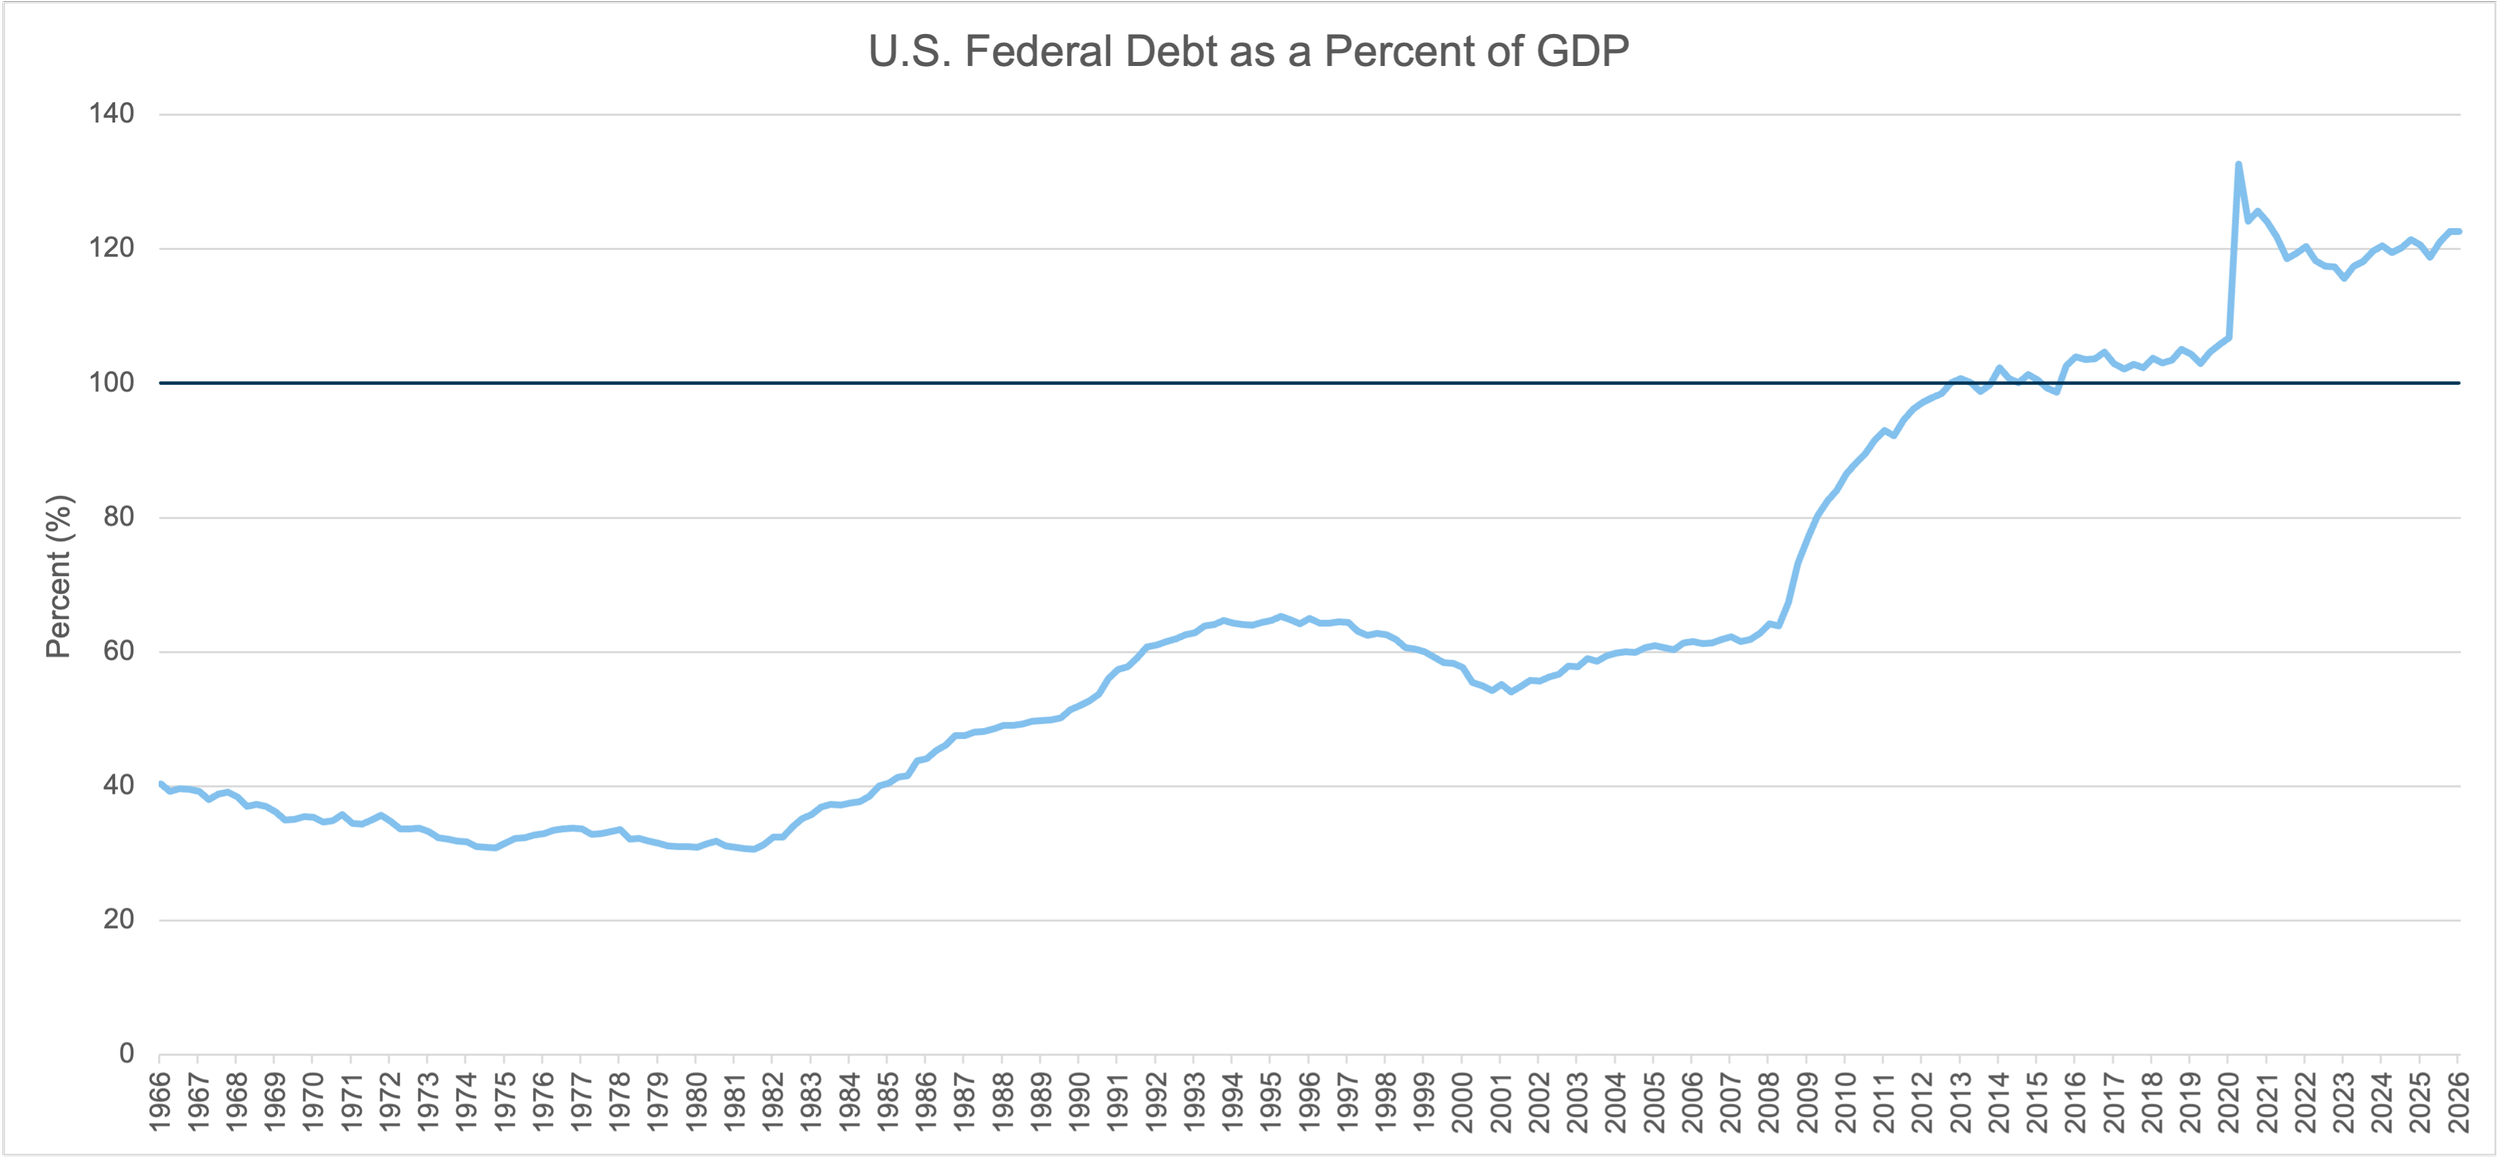
Sources: SJS Investment Services; Federal Reserve Bank of St. Louis, FRED; U.S. Office of Management and Budget; U.S. Department of the Treasury. Data as of August 1, 2026. U.S. federal debt is represented by Federal Debt: Total Public Debt as a Percent of Gross Domestic Product [GFDEGDQ188S]. Total public debt, also referred to as gross federal debt, includes debt held by the public and intragovernmental holdings. The ratio is calculated by dividing total public debt by gross domestic product (GDP). FRED series GFDEGDQ188S, retrieved October 14, 2026. See Important Disclosure Information.
How Growing Debt Can Affect Markets
Persistent federal deficits require the Treasury to issue additional debt. Over time, greater debt can contribute to higher interest rates if investors demand additional compensation to absorb that borrowing.
Higher rates matter throughout the economy. Mortgage rates, for example, have historically been closely tied to the 10-year Treasury yield.[3] Higher Treasury yields can also increase corporate borrowing costs, raise discount rates used to value stocks and real estate, and make financing new investment more expensive.
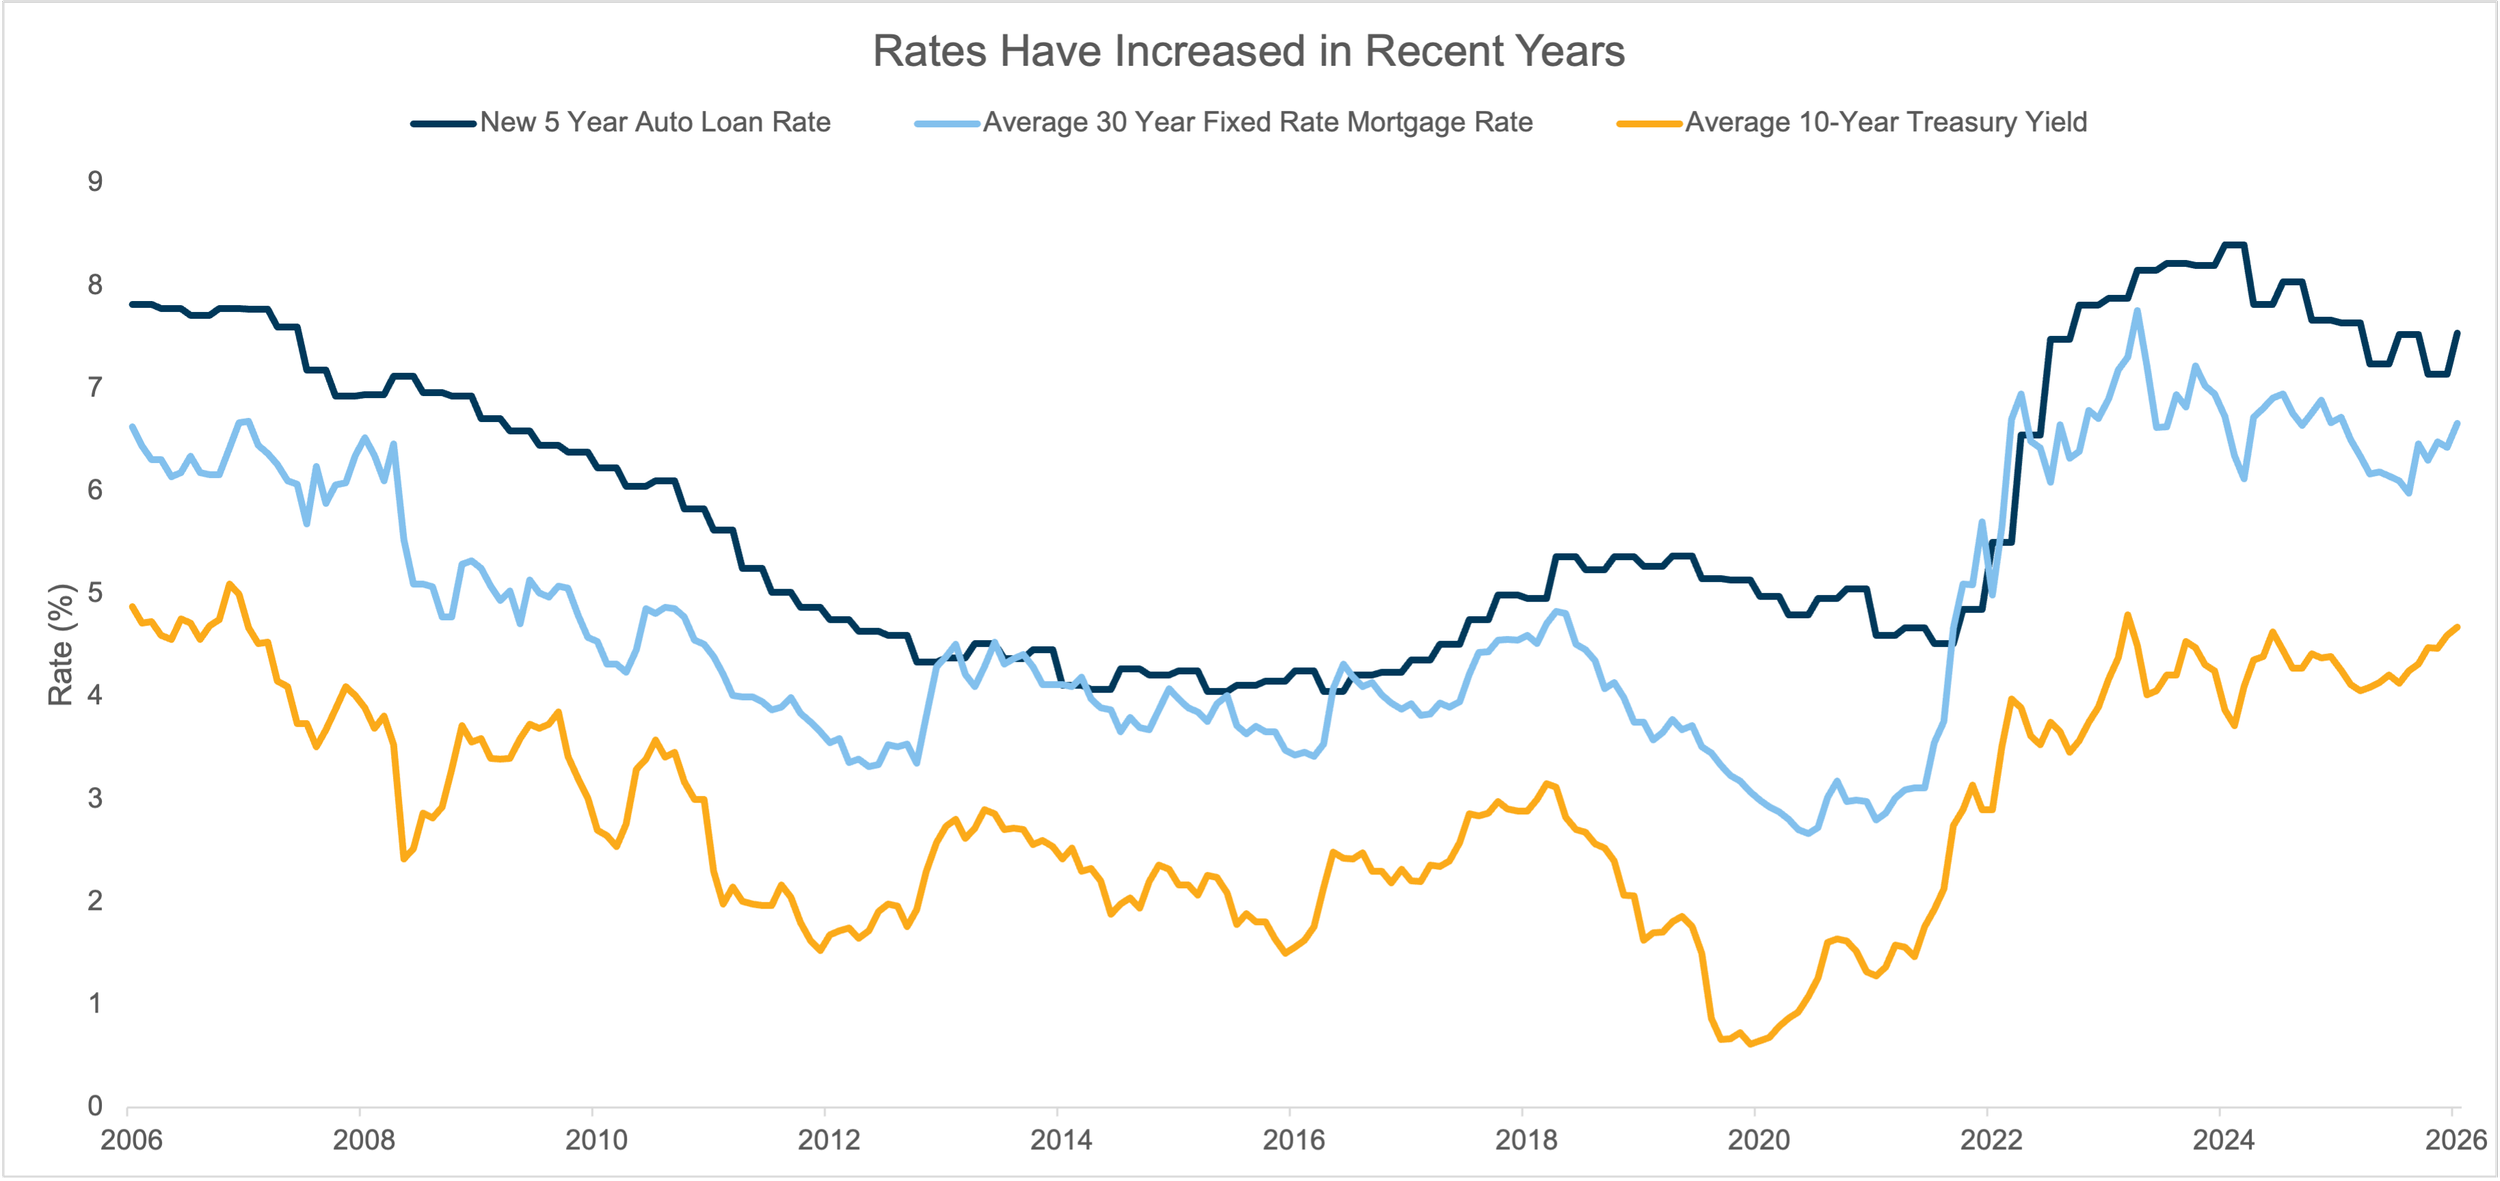
Sources: SJS Investment Services; Freddie Mac; Board of Governors of the Federal Reserve System; Federal Reserve Bank of St. Louis, FRED. Data shown span August 2006 through August 2026. New 5-Year Auto Loan Rate is represented by Finance Rate on Consumer Installment Loans at Commercial Banks, New Autos 60-Month Loan. Average 30-Year Fixed Mortgage Rate is represented by 30-Year Fixed Rate Mortgage Average in the United States. Average 10-Year Treasury Yield is represented by Market Yield on U.S. Treasury Securities at 10-Year Constant Maturity, Quoted on an Investment Basis. Rates are expressed as percentages. Data are provided for informational purposes only and are not intended as investment advice. See Important Disclosure Information.
At the same time, rising federal interest expense creates a feedback loop. More debt means more interest expense, which can contribute to larger future deficits and additional borrowing. The CBO projects that federal net interest costs will rise from 3.3% of GDP in 2026 to 4.6% by 2036.[2]
There is also a potential currency implication. Issuing Treasury debt does not directly “print money” or automatically weaken the dollar. But if investors eventually become concerned about the government's ability to stabilize its fiscal position, this could lead to some combination of higher interest rates, higher inflation or a weaker currency.
That outcome is possible, but it is not predetermined.
Today's Interest Rates Are About More Than Debt
It is also important not to attribute every move in Treasury yields to federal borrowing.
Recent interest rate increases have also reflected inflation concerns, changing expectations for Federal Reserve policy, and higher energy prices associated with the conflict with Iran. The Federal Reserve issued an FOMC statement in July saying that inflation remains above its 2% objective, in part because of energy-related supply shocks.[4]
If geopolitical tensions ease and oil prices decline, inflation expectations could moderate and some of the recent upward pressure on interest rates could reverse. The longer-term fiscal challenge would remain, but today's level of interest rates should not be viewed solely as a vote of no confidence in U.S. finances.
Does High Debt Automatically Lead to a Crisis?
History suggests it does not necessarily.
Japan is an important example. The IMF estimates Japanese gross public debt exceeds 200% of GDP in 2026, yet it continues to finance that debt without a sovereign funding crisis. Japan benefits from a long debt maturity structure, a deep domestic investor base, substantial public-sector assets, and debt denominated in its own reserve currency.[5]
The United States is different, but the lesson is useful: there is no specific debt-to-GDP number at which a developed economy automatically reaches a breaking point.
How Should Investors Respond?
We do not believe investors should attempt to solve this national debt uncertainty with one large bet on interest rates, inflation, or the dollar.
Instead, the investment portfolio itself can have multiple hedges.
If inflation remains elevated, inflation-protected bonds, commodities, and real assets may help. If economic growth weakens, high-quality bonds can provide diversification. If there are concerns about the U.S. dollar weakening, then international equities, global bonds, and foreign currencies provide exposure outside the U.S. If economic growth remains strong, stocks can benefit. Alternative strategies can provide additional return sources that are less dependent on traditional stock and bond markets.
The objective is not to correctly predict exactly how the national debt will evolve over time. We focus on how to build a diversified investment portfolio capable of navigating several possible outcomes.
The U.S. fiscal trajectory deserves attention. But for long-term investors, we believe disciplined diversification remains a more durable response than trying to predict the next moves in Washington, interest rates, or the U.S. dollar.
Sources & Important Disclosure Information:
[1] “Debt to the Penny”. U.S. Department of the Treasury, September 2026, fiscaldata.treasury.gov.
[2] “The Budget and Economic Outlook: 2026 to 2036”. Congressional Budget Office, March 2026, cbo.gov.
[3] “What Determines the Rate on a 30-Year Mortgage?” Nathaniel Drake, 11-Dec-2024, fanniemae.com.
[4] “Federal Reserve issues FOMC statement”. Board of Governors of the Federal Reserve System, 29-Jul-2026, federalreserve.gov.
[5] “Japan’s Debt Beyond the Headlines”. Rahul Anand & Shujaat Khan, September 2026, imf.org.
There is no guarantee investment strategies will be successful. Past performance is no guarantee of future results. Diversification neither assures a profit nor guarantees against a loss in a declining market.
Advisory services are provided by SJS Investment Services, a registered investment advisor (RIA) with the SEC. Registration does not imply a certain level of skill or training. SJS Investment Services does not provide legal or tax advice. Please consult your legal or tax professionals for specific advice.
Statements contained in this article that are not statements of historical fact are intended to be and are forward looking statements. Forward looking statements include expressed expectations of future events and the assumptions on which the expressed expectations are based. All forward looking statements are inherently uncertain as they are based on various expectations and assumptions concerning future events and they are subject to numerous known and unknown risks and uncertainties which could cause actual events or results to differ materially from those projected.
Indices are not available for direct investment. Index performance does not reflect the expenses associated with management of an actual portfolio. Index performance is measured in US dollars. The index performance figures assume the reinvestment of all income, including dividends and capital gains.